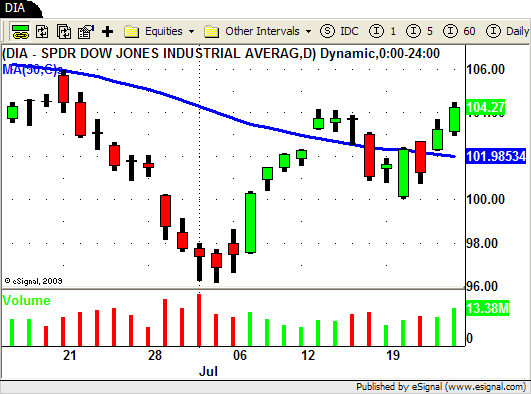
Wow! What a difference a week makes!
After last Friday's sell off every talking head in the media was predicting "doom and gloom" and DOW 8000.
When the market closed today you heard nothing but what a GREAT market this is and how we could be headed for new highs!
I have long ago dismissed most of what is said on CNBC, Bloomberg, etc. and watch and listen now solely for entertainment purposes.
As a trader I think it can be very misleading and can often times cloud your decision making process.
Do your own research and follow the rules of the system you put in place based on the result of your research.
I say this because a few traders that I talked to this week said that they were not even looking to the LONG side of the market because "everyone I hear on TV is bearish on the market".
As a short term trader you need to be in sync with market.
By being "in sync" with the market often times you can profit from short term price swings regardless of the overall market environment.
Being prepared for whatever the market does is half the battle.
During our "Swing Trading Weekly Wrap Up" webinar last night there was one question that came up a few times.
A few people asked how we were able identify any LONG trades this week since the overall market was in such a obvious DOWN trend.
These traders, like the ones mentioned above, were also only focused on the SHORT side of the market and essentially missed the move up in the market this week.
Part of our answer to this question is that we ALWAYS have a list of STRONG and WEAK stocks and ETF's on our watchlist.
During the past few weeks we have been mostly focused on the WEAK stocks since we were in a down trending environment.
At the same time though we maintained a list of stocks and ETF's that were showing relative strength to the overall market.
When the market gives us "clues" that it may be transitioning from one mode to the other (in this case from DOWN to UP) we are turn to this list to look for trading opportunities.
For beginning swing traders we always recommend that you trade on the same side of the 50 period SMA as the overall market.
We use this as a "dynamic" trend line to keep new traders on the right side of the market.
So, for example, if the market is trading below the 50 period SMA look for trade setups in stocks and ETF's that are also trading below the 50 period SMA.
When the overall market is trading near the 50 period SMA looking for trade setups on BOTH sides of the market is often times a good idea.
That way when the market gives you confirmation on which way it is headed you can on the right side if the market and take the appropriate trades.
This week we saw this exact setup in the market.
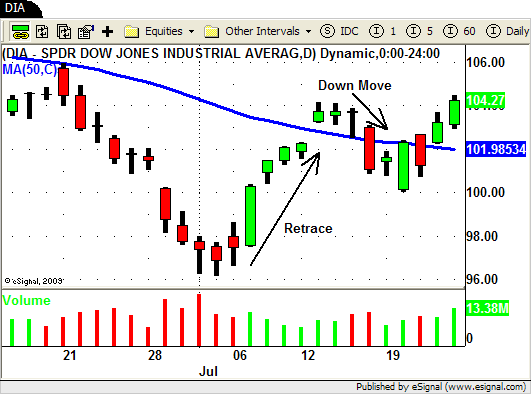
After hitting new yearly lows at the beginning of the month the market put in a decent retrace until July 14th.
The next move DOWN started on the 15th and was followed by a "high volume' sell off last Friday.
During this time most of our SHORT trades (ALL, MET, ZION, LNC, etc.) worked out very well and we were able to take profits in our positions.
Some of our other SHORT positions (SLX, CLF) we a little slower to move to the down side.
Since we are SHORT we need to see a few things to let us know that the trend is still down and going lower.
We need to see price action moving lower and volume moving higher.
This lets us know that sellers are jumping back on board to move prices lower.
Monday the price action in the overall market and in some of our positions was less than impressive.
Volume was significantly less than Friday as well.
Not exactly the follow through you would expect after such a big sell off on Friday.
Our slow moving SLX SHORT actually creates a low volume "inside day"…a classic price stall.
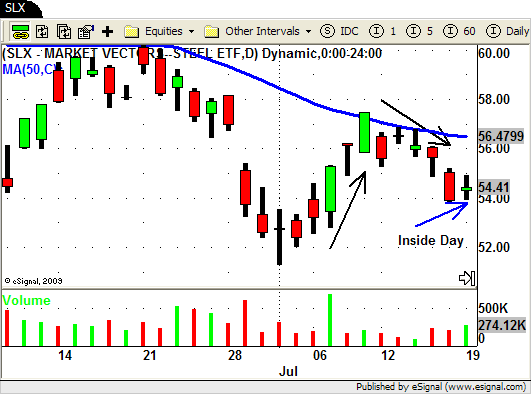
We failed to get what we need to confirm we are still headed lower.
This "stalling" price action gives us our first "clue" and puts us on "high alert" that sentiment MAY change.
These "stalls" dont give us an exit signal from our SHORT positions just yet.
We still need confirming price action (and volume) to take action.
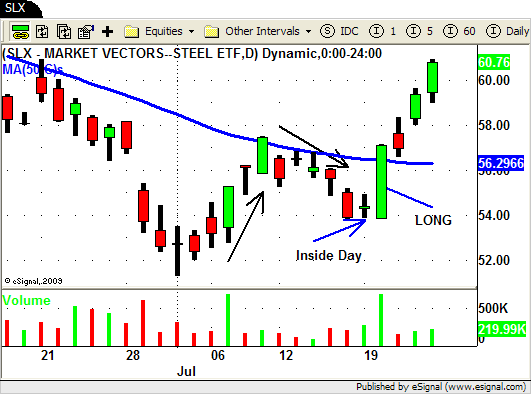
Tuesday's "gap and go" was CLEAR sign that SHORT was the wrong side on the market.
We were able to cover our SHORT in SLX for a tiny profit and our CLF SHORT at break even.
We not only covered our SHORT trade in SLX we actually flipped to the LONG side based on the context of the market and the sector itself.
We did NOT flip to LONG in CLF but we did buy AKS since it had a stronger chart pattern.
Notice the LOW volume 3 day pullback prior to AKS ripping higher.
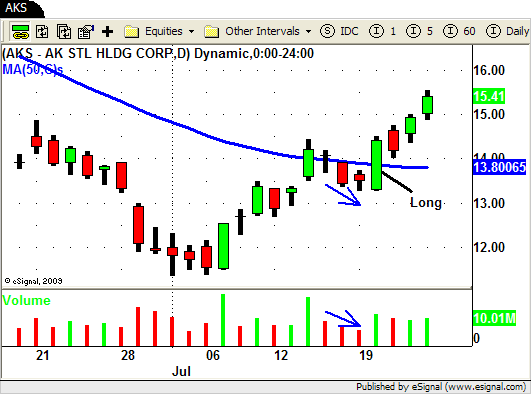
Both SLX and AKS were trading at their 50 day SMA's and Tuesday UP move created a DOWN trend break out in both as they traded and closed above their 50 day SMA.
These were both "trend transition" type trades and may have been a little difficult for some traders to identify.
There were however plenty of STRONG stocks (trading ABOVE their 50 day SMA) to turn to once the market started its UP move.
Several chip stocks (ALTR, XLXN, MCHP, LLTC) were showing tremendous relative strength lately and offered up some nice trade setups.
Plenty of other stocks presented the same opportunity – HAL, ALK, CRM, AKAM, HMIN, NTAP, AXP, JNPR, and ATVI just to name a few.
Pull up the charts so you can see how these "strong" stocks reacted when the market pushed to the UP side.
Be prepared for anything and everything!
If you want to know exactly how we find the best Swing Trading Setups please join us at our upcoming webinar this Friday night!
Until next week…Good Trading to YOU!
Tags: ETF Swing Trading, SLX, Swing Trading, Swing Trading Blog, Swing Trading Chart Patterns, Swing Trading Price Action, Swing Trading Strategies, Swing Trading Volume, Trading Volume


[…] Blog « Swing Trading Week in Review – July 23, 2010 […]