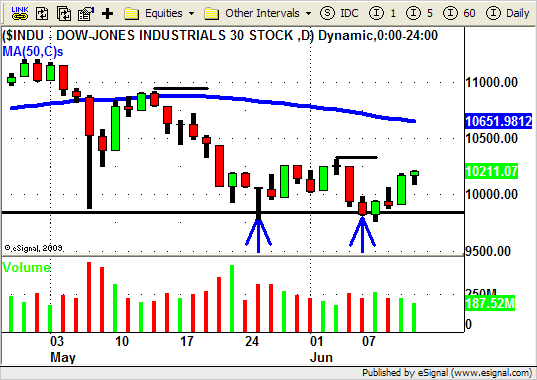
Another interesting week in the market!
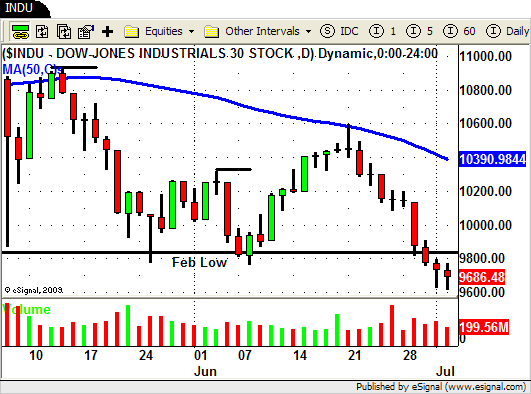
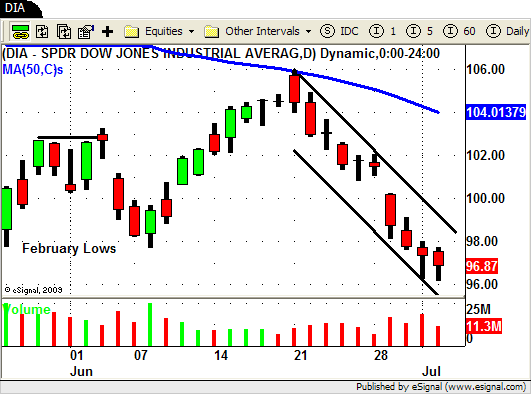
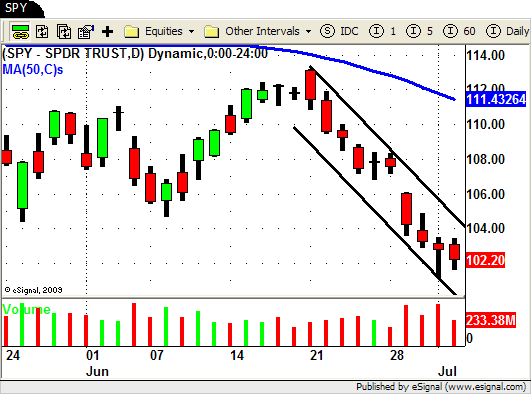
After pulling back off of the recent lows the market heads back down as sellers aggressively drove the market down on Friday.
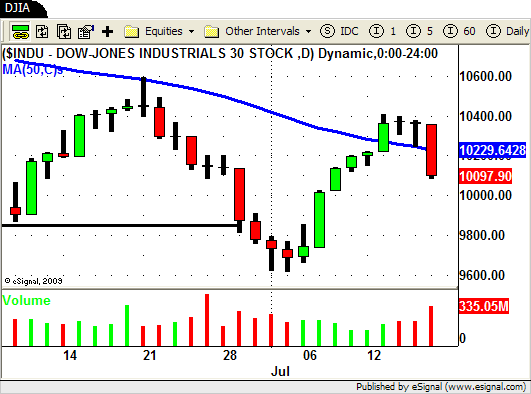
Last week we saw the market pullback on LOW volume so going into this week we were looking for signs that this "retrace" was losing steam.
Monday and Tuesday's price and volume action let us know that the overall market had NOT yet ended its retrace BUT some of the individual stocks and ETF's that were on our watch list told a different story.
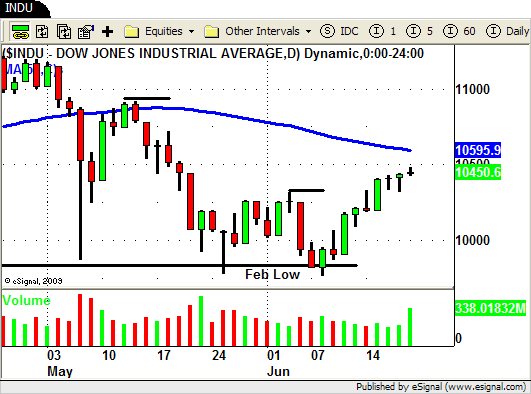
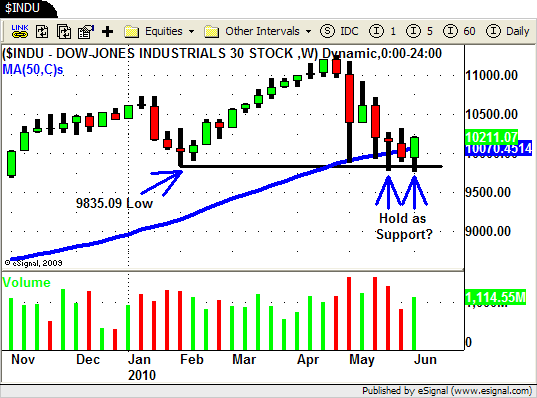
Since we have recently taken out the February lows in the market and we are still trading under the 50 day SMA our bias remains to the SHORT side for our "bread and butter" strategy.
In a perfect world we would be able to time our trades to match when the overall market makes its move but usually that is not the case.
Often times individual stocks (or specific sector ETF's) will lead the market by moving prior to the overall market.
In a down trending environment we often see the "weakest" stocks start to move lower even as the market is moving slightly higher.
The opposite is true for a up trending market.
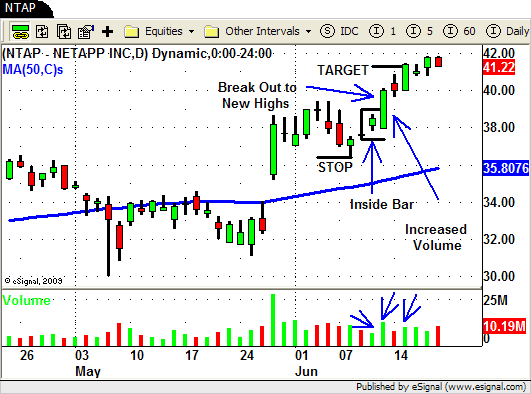
"Strong" stocks will often breakout well before the overall market gives you confirmation that it is going higher.
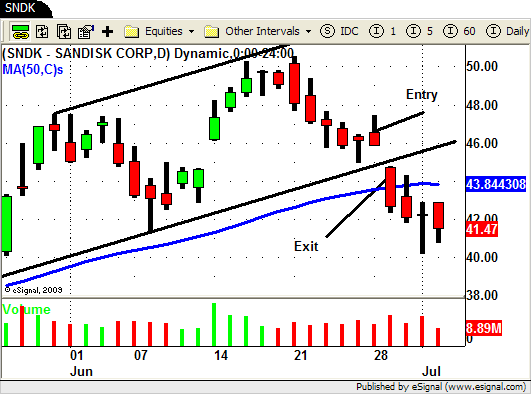
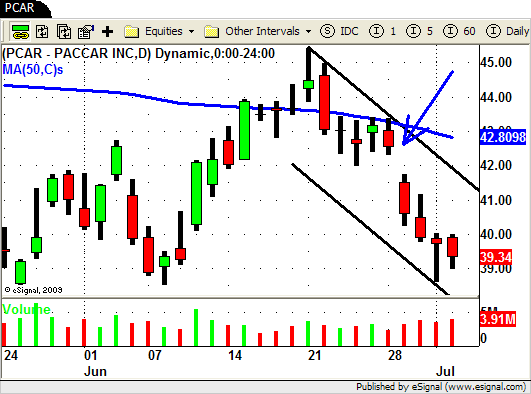
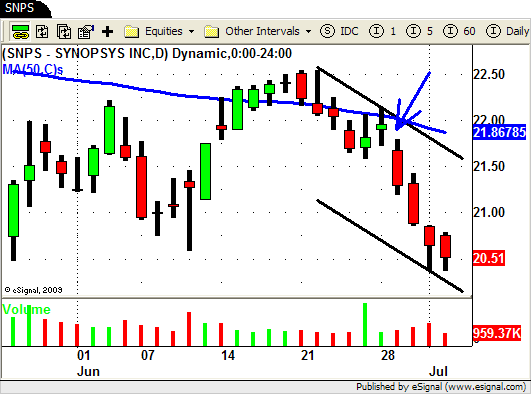
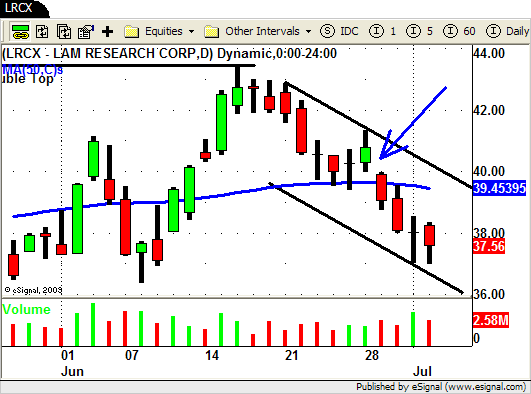
We saw this happen at the beginning of the week as several of the stocks on our watch list triggered a SHORT entry signal.
Monday the market started to head lower but ended up closing near its high albeit on lower volume.
When the market gapped up on Tuesday some of our SHORT positions moved UP with right along with it.
The gap up in these stocks was of some concern but most stayed well below our initial STOP LOSS levels so we simply held our positions.
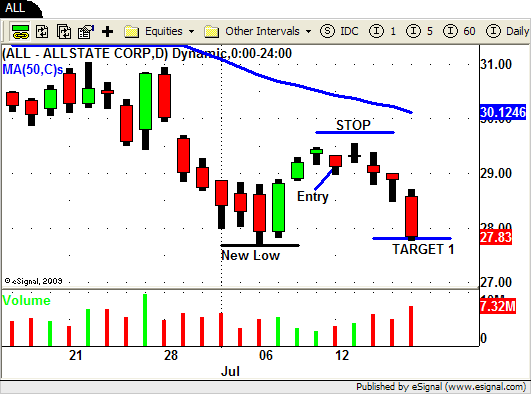
Allstate (ALL) is one our trades that triggered on Monday.
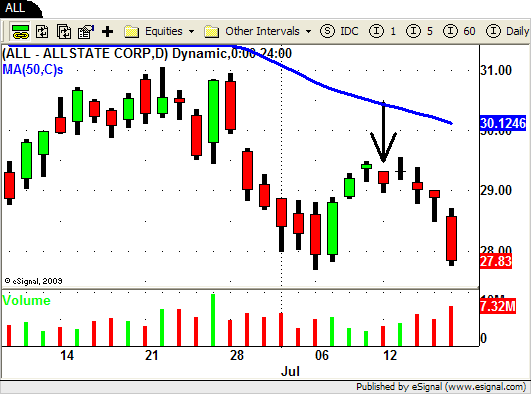
After hitting new yearly lows last week ALL put in a nice LOW volume 3 day retrace at the end of last week.
Monday you can see how ALL traded through Friday's low on increasing volume.
Our SHORT entry was triggered and we set our initial STOP LOSS level at $29.87 which is 1 ATR ( .77) away from our entry ($29.10).
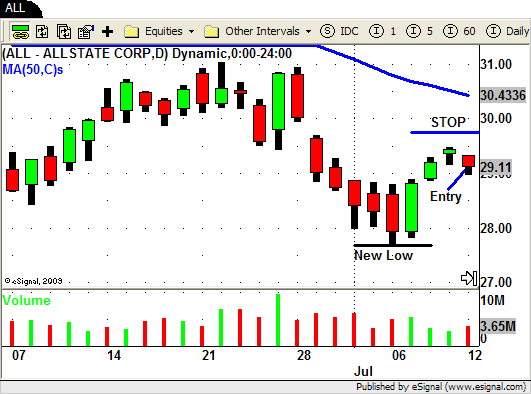
It is important to note here that by using the Average True Range (ATR) of the stock we were able to position our stop above an area where a chart pattern based stop would have been placed.
Using our Average True Range (ATR) again we would use a multiple of 2 (2 x .77= $1.54) to set our profit target at $27.57 ($29.20 – $1.54= $27.56).
However based on the chart we set our initial PROFIT TARGET at $27.78 which is just above the previous Swing Low at $26.68.
This is not quite a 2:1 risk/reward but we put our target just above the possible support level and would cover a portion of our position at this level and let the remaining shares run.
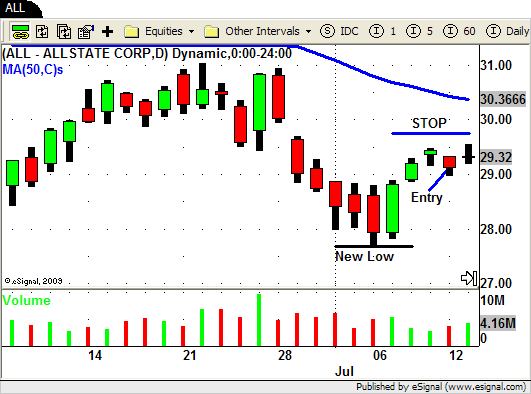
Tuesday you can see how ALL gapped up a bit with the overall market but stays well below our ATR based stop.
Wednesday ALL finally follows through to the down side and volume increases even as the overall market holds up.
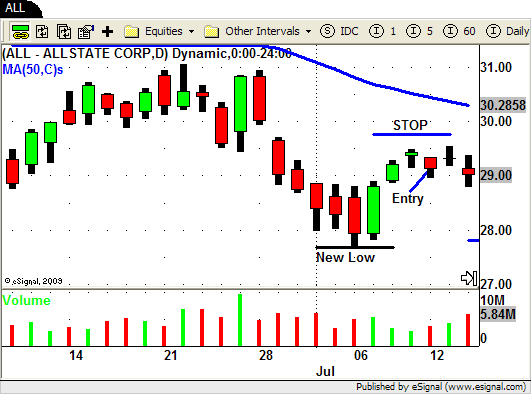
The end of the week brings more more of the same and near the close on Friday ALL hits profit target #1 as the market sells off.
Some of the other stocks on our list that turned out to be good SHORT trades were APC, ZION, CLF, and SLX.
There were a lot of trades this week and its hard to go over them all in this BLOG.
At our "Indicators and Oscillators" webinar last night we went through each and every one of our trades.
We analyzed trades in MOS, AKAM, ALTR, XLNX, and ETF's like DXD, SRS and SKF.
We discussed how we use our indicators in conjunction with price action, volume and trend lines to make our trading decisions.
Based on the feedback we received it was a very insightful webinar for you short term traders!
Our next webinar is our popular "Swing Trading Weekly Wrap Up" where we do more of the same.
We analyze the market and sector ETF's and go over our trades in detail.
Please bring your questions and the symbols of the stocks or ETF's you want to discuss.
We look forward to seeing you there!
Until next week…Good Trading to YOU!

