Posts Tagged ‘Sector ETF’s’

Swing Trading BLOG – Week in Review – May 6, 2011

Saturday, May 7th, 2011

Swing Trading BLOG – Swing Trading BOOT CAMP

The overall market SOLD OFF this week as sellers stepped and drove stocks lower.

The SELL OFF came in INCREASED VOLUME after the market pushed higher last week on less than stellar volume.

The SELL OFF has traders looking to INVERSE ETF's for possible trade setups in the very near future.

The Energy and Oil ETF's took a hit and and going to be sectors to watch moving into next week.

Agriculture ETF's continue to show weakness and the Steel sector could be headed towards a NEW LOW.

You can see a Technical Analysis walk through on one of the weak Agriculture stocks ($MOS) by clicking HERE.

The Retail and Semiconductor ETF's and holding up very well during this recent PULL BACK in the market.

Despite the recent selling pressure just remember that the market is still trading above its 50 day SMA.

The are more Swing Trading opportunities on BOTH sides of the market now so that tells us that we are at a pivotal point.

There are still plenty of strong stocks to watch ($R, $INFA, $K, $WLK, $ERTS, $M) so make sure to have a plan for next week.

If we trade higher on good volume next week the market could continue its move up.

If we trade higher and volume doesn't follow through then we could be in for another leg down in the near term.

Until next week…Good trading to YOU!

Swing Trading BLOG – Swing Trading Week in Review – April 21, 2011

Sunday, April 24th, 2011

Swing Trading BLOG – Swing Trading BOOT CAMP


Swing Traders watched as the Dow Jones Industrial Average moved to NEW HIGHS this holiday shortened week.

Earnings news in the Technology sector influenced the markets early in the week and lead to a nice GAP UP on Wednesday.

This news brought buyers into the market and lifted the Technology ETF ($XLK) back above its 50 day SMA by weeks end.

The Semiconductor sector ($SMH) also got a lift this week and is also now trading back above its 50 day SMA.

Silver and Gold continue to show their strength with both sector ETF's ($SLV $GLD) trading to new multi month highs again this week.

Looking around at some individual stocks there still seems to be a bit of indecision in some sectors.

There are great stocks like $LULU, $SINA, $WLK and $SIRO.

Then there are not so great stocks like $CREE, $WFC and most of the airline stocks.

It will be interesting to see how these stocks do if the market continues to move higher.

Next week we will watch to see if the S&P 500 follows suit and BREAKS OUT to NEW HIGHS as well.

We are still in LONG only mode but we will be prepared for whatever the market decides to do from here.

Until next week…Good Trading to YOU!

**No charts this week due to a problem with Esignal data**

Swing Trading BLOG – Week in Review – April 15, 2011

Sunday, April 17th, 2011

Swing Trading BLOG – Swing Trading BOOT CAMP

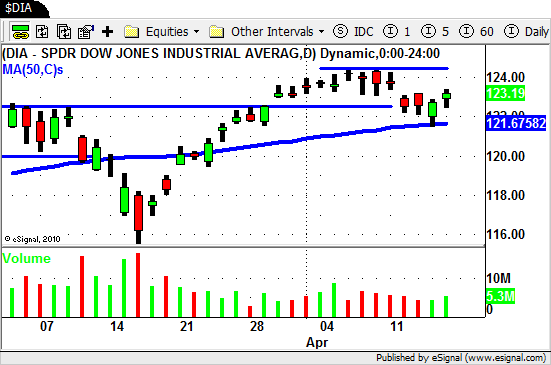
$DIA

After failing to break out to the upside on Monday the market put in a nice orderly pullback to its 50 day SMA this week.

The overhead resistance is in place and its a good sign when the 50 day holds as support.

In order for us to stay optimistic about this market moving higher we are going to have to see price action and volume confirm our thoughts.

If the market stalls looks for clues that a short term trend transition may be in order.

Earlier this week we posted a list of Gold Stocks to watch and a list of Silver ETF's.

We posted these to remind you of the recent strength in these two sectors.

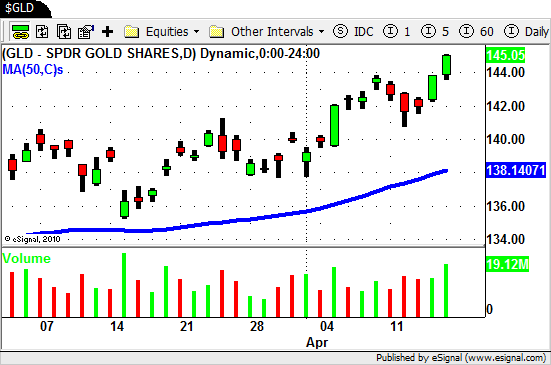
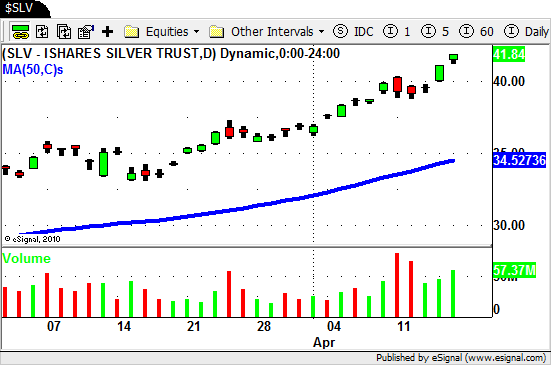
Lets take a look at the chart for the Gold ($GLD) and Silver ($SLV) ETF's

$GLD $SLV

Both sector ETF's are in solid UP TRENDS and offered yet another opportunity for Swing Traders to profit.

While some Swing Trading BLOGS were actually advocating SHORTING these sectors we remained BULLISH due to the obvious strength.

No one knows for sure what the future holds but for now these two are about the strongest sectors in the market.

Until next week…Good Trading to YOU!

Swing Trading Week in Review – April 1, 2011

Sunday, April 3rd, 2011

Swing Trading BLOG – Swing Trading BOOT CAMP

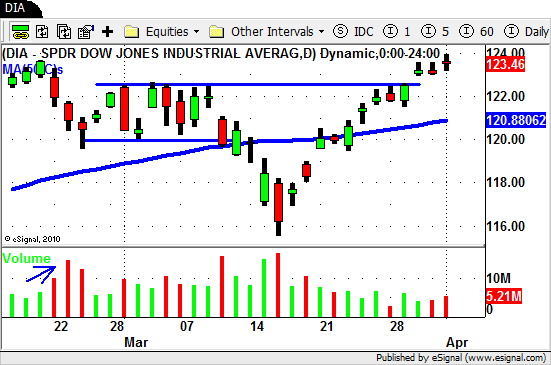
New High for the Year in the DJIA???

Really?
$DIA

As hard as it is to believe the DJIA actually traded to a NEW HIGH for the year on Friday.

As such a strong SELL OFF a few weeks ago the "bounce" we have seen turned into a nice rally to NEW HIGH territory.

As SHORT TERM traders we need to be in touch with the market on a daily basis a learn to look for signs that the market gives us.

Learning when SHORT TERM trends change is, we believe, a vital skill to learn if you are to become a successful Swing Trader.

Although we always have a list of LONG and SHORT trade candidates on our Watch List the idea is to learn when to take the trade or let it pass.

We like to be LONG when the market is strong and looking to get stronger.

We look to get SHORT when the market is weak and is looking like the weakness will continue.

As simple as this sounds it is of course easier said than done!

There are many "pivotal" times (as we call them) where the market is showing signs of change but has yet to confirm its true direction.

It is at these times when we tend to trade both sides of market and once the market makes up its mind we hold the trades that are working out and usually get STOPPED OUT of the trades that are on the wrong side of the market.

On these trades that STOP us out we, at times, will also flip from LONG to SHORT or SHORT to LONG **if** the situation is right.

It is at these times that noticing HOW short term trends change helps us identify these trades.

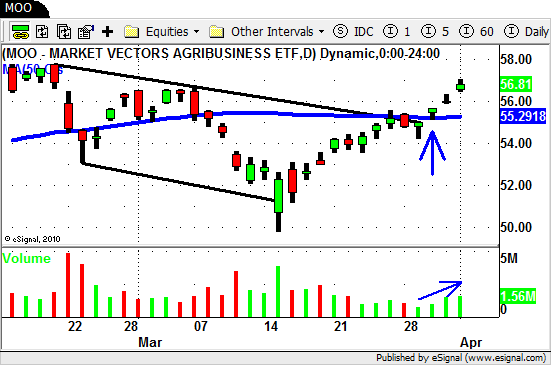
A few BLOG posts ago we mentioned that we were watching the Agriculture ETF's ($MOO $DBA) and the stocks in this sector for potential SHORT trades.

In the chart of $MOO below you can see the DOWN trend lines in BLACK.

The pullback we saw after the SELL OFF brought $MOO right back up to its 50 day SMA.
$MOO

The SHORT trade we were looking for never triggered in this example and a LONG trade was taken after the DOWN TREND BREAKOUT and break of the 50 day SMA.

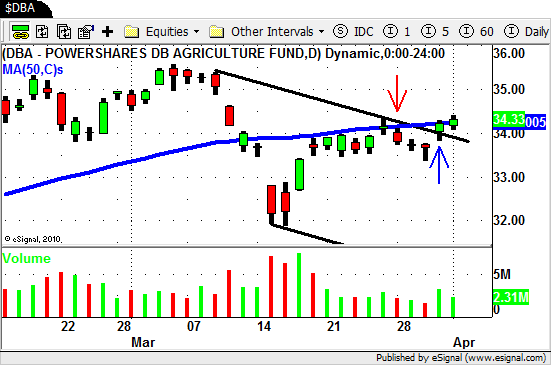
If on the other hand we decided to trade $DBA instead a SHORT trade did trigger.

Take a look at the chart below…
$DBA

Had we taken the SHORT trade at the RED ARROW we need to manage our trade and watch for signs of change.

Three trading days after entering the trade that sign of change presented itself.

A DOWN TREND BREAKOUT at the 50 day SMA on INCREASED VOLUME!

This is an example of a situation where a flip to the LONG side would have been in order.

This DOES NOT however mean that once we "flipped" to LONG that all is good.

We still need to monitor our position and look for confirmation that the SHORT TERM trend will remain in tact.

Whether you decide to actually trade these SHORT TERM trend changes or simply identify them to confirm your thoughts of the market is of course up to you.

Either way learning how to notice the clues that the market gives you should be on the top of your "things to learn" list.

We hope you find this information useful and until next week…Good Trading to YOU!

© Swing Trading Boot Camp 2024