Swing Trading BLOG – Swing Trading BOOT CAMP
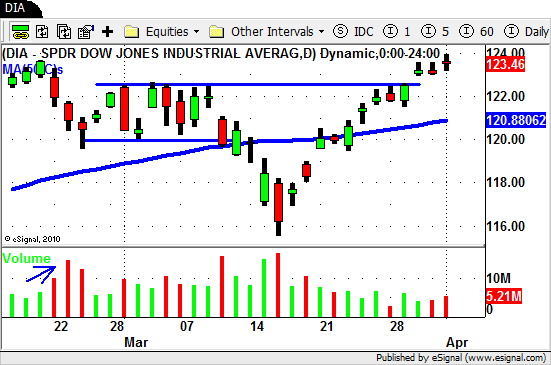
New High for the Year in the DJIA???
Really?

As hard as it is to believe the DJIA actually traded to a NEW HIGH for the year on Friday.
As such a strong SELL OFF a few weeks ago the "bounce" we have seen turned into a nice rally to NEW HIGH territory.
As SHORT TERM traders we need to be in touch with the market on a daily basis a learn to look for signs that the market gives us.
Learning when SHORT TERM trends change is, we believe, a vital skill to learn if you are to become a successful Swing Trader.
Although we always have a list of LONG and SHORT trade candidates on our Watch List the idea is to learn when to take the trade or let it pass.
We like to be LONG when the market is strong and looking to get stronger.
We look to get SHORT when the market is weak and is looking like the weakness will continue.
As simple as this sounds it is of course easier said than done!
There are many "pivotal" times (as we call them) where the market is showing signs of change but has yet to confirm its true direction.
It is at these times when we tend to trade both sides of market and once the market makes up its mind we hold the trades that are working out and usually get STOPPED OUT of the trades that are on the wrong side of the market.
On these trades that STOP us out we, at times, will also flip from LONG to SHORT or SHORT to LONG **if** the situation is right.
It is at these times that noticing HOW short term trends change helps us identify these trades.
A few BLOG posts ago we mentioned that we were watching the Agriculture ETF's ($MOO $DBA) and the stocks in this sector for potential SHORT trades.
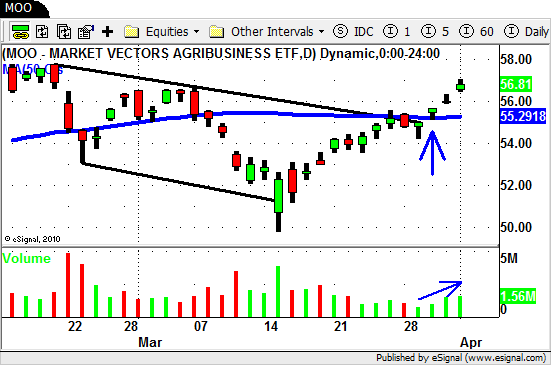
In the chart of $MOO below you can see the DOWN trend lines in BLACK.
The pullback we saw after the SELL OFF brought $MOO right back up to its 50 day SMA.

The SHORT trade we were looking for never triggered in this example and a LONG trade was taken after the DOWN TREND BREAKOUT and break of the 50 day SMA.
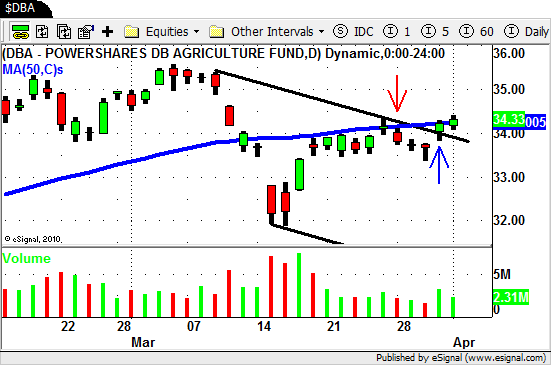
If on the other hand we decided to trade $DBA instead a SHORT trade did trigger.
Take a look at the chart below…

Had we taken the SHORT trade at the RED ARROW we need to manage our trade and watch for signs of change.
Three trading days after entering the trade that sign of change presented itself.
A DOWN TREND BREAKOUT at the 50 day SMA on INCREASED VOLUME!
This is an example of a situation where a flip to the LONG side would have been in order.
This DOES NOT however mean that once we "flipped" to LONG that all is good.
We still need to monitor our position and look for confirmation that the SHORT TERM trend will remain in tact.
Whether you decide to actually trade these SHORT TERM trend changes or simply identify them to confirm your thoughts of the market is of course up to you.
Either way learning how to notice the clues that the market gives you should be on the top of your "things to learn" list.
We hope you find this information useful and until next week…Good Trading to YOU!
Tags: ETF Swing Trading, Sector ETF's, SHORT SWING TRADING, Swing Trading, Swing Trading Blog, Swing Trading Chart Patterns, Swing Trading Price Action

