Posts Tagged ‘RTH’

Swing Trading Week in Review – September 17, 2010

Friday, September 17th, 2010

Swing Trading BLOG – Swing Trading Boot Camp

The UPWARD drift continues!

In last week's BLOG POST we mentioned the lack of volume we are seeing and the need for volume to increase to move this market decisively higher.

Well the market did move up this week but as the first line of this post states it was more of a drift than a significant move.

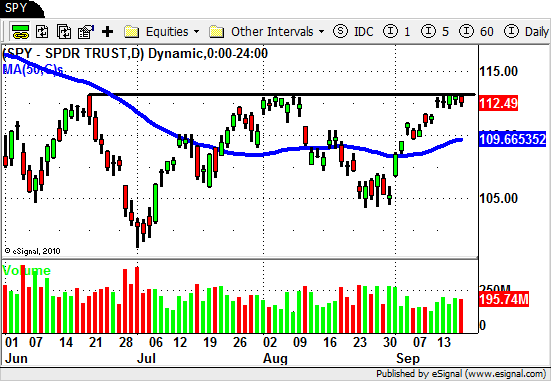
The move this week puts us right back up to the June 21st price levels that we saw just prior to the sell off that took us to NEW LOW'S for the year.
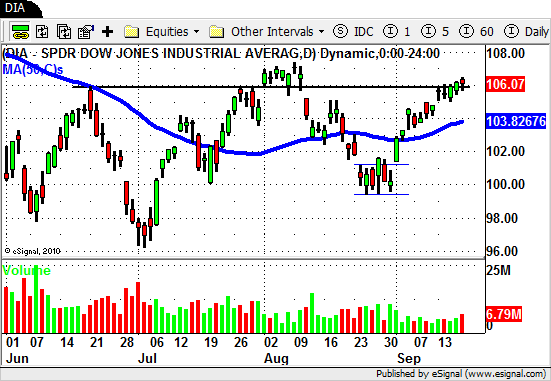
DIA - DJIA ETF

The best chart that illustrates the larger sideways trading channel we are in has to be the chart of the S&P 500 Index.

Here is the chart for the SPY to show how this weeks trading action brings us right to very top of this channel.
SPY - SP500 ETF

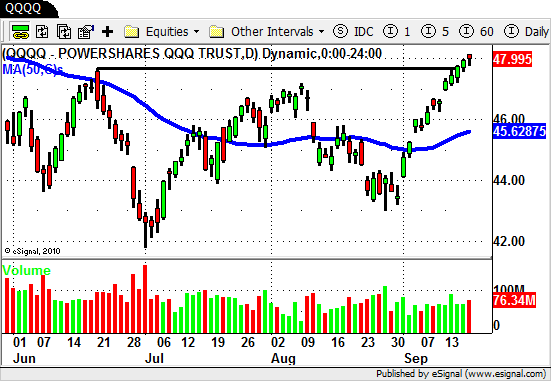
The Nasdaq has actually been a bit stronger.

This most recent UP move brings to QQQQ'S above that all important level set on June 21st but after a 12 day up move it seems way overbought in the short term.
QQQQ

As far as sectors go it is pretty much the same story as last week.

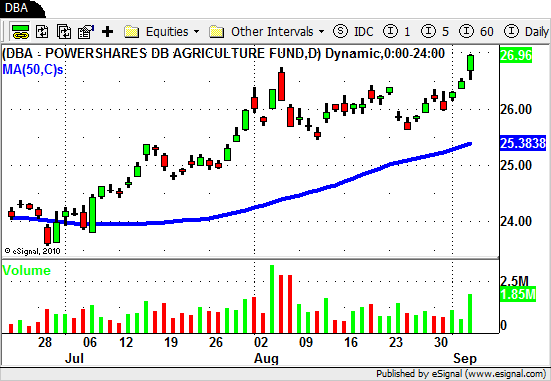
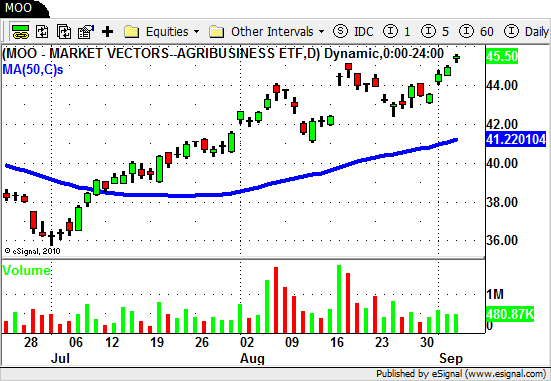
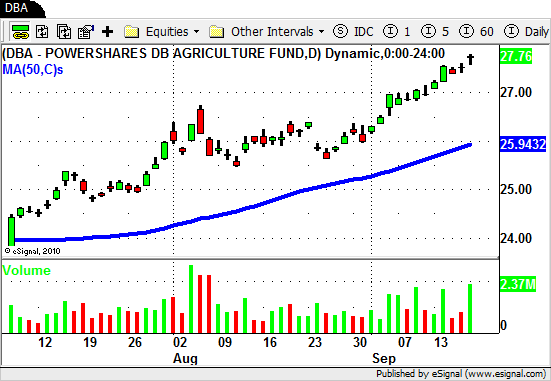
The Agriculture ETF's (DBA and MOO) remain strong with several stocks in this sector pushing higher this week.

DBA actually pushed to a NEW HIGH for the year this week while MOO trades a bit below its yearly high.
DBA - Agriculture ETF

In last week's post we mentioned a few stocks to watch in this sector coming into this week.

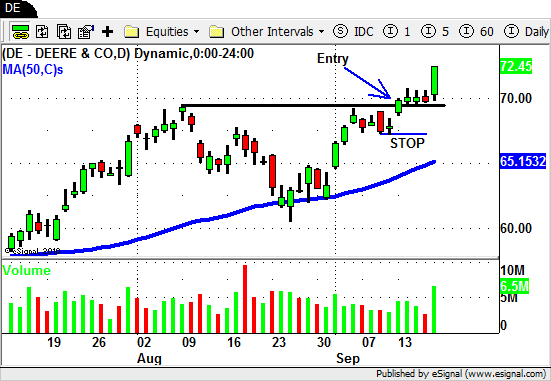
One of the few trades we made this week was in John Deere & Company (DE) which is one of the biggest holdings in MOO.
DE

After showing so much recent relative strength DE put in a nice tight sideways consolidation pattern last week.

As the market GAPPED UP on Monday DE was up right along with it.

Our original entry target was just above the high set in early August which was $69.47.

When the market rolled over mid morning DE stayed strong as we entered into a position at $69.55.

Our initial STOP LOSS level is set at $67.10 which is just below the recent consolidation area.

This puts our initial risk at $2.45/share.

Our PROFIT TARGET is set at $74.45 which is twice our initial risk per share ($2.45 x 2= $4.90 + $69.55).

After 3 more days of consolidation DE made a HIGH VOLUME UP MOVE today and finally pushed our position nicely to the UPSIDE.

The trade is still open so we will manage our position accordingly and let you know how it turns out.

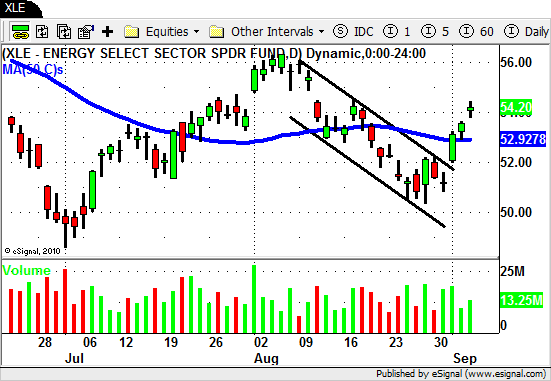
As far as the other sector's in the market go we cautioned you last week about the LOW VOLUME moves in XLE and RTH.

XLE actually put in a retrace this week despite the strength in the overall market.
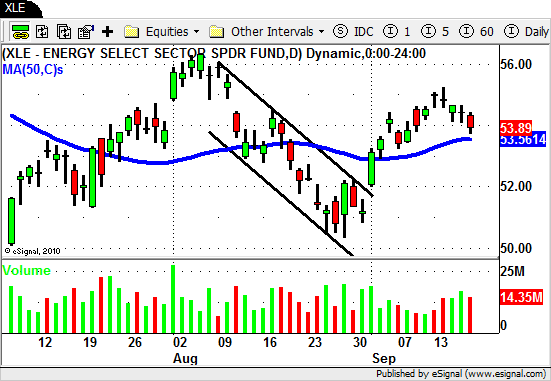
XLE - Energy ETF

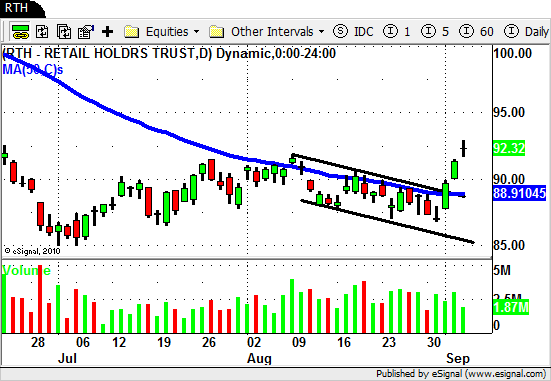
RTH on the other hand GAPPED UP nicely with the market on Monday and then followed WITH VOLUME on Tuesday.

A nice move UP since breaking the DOWN TREND channel line.
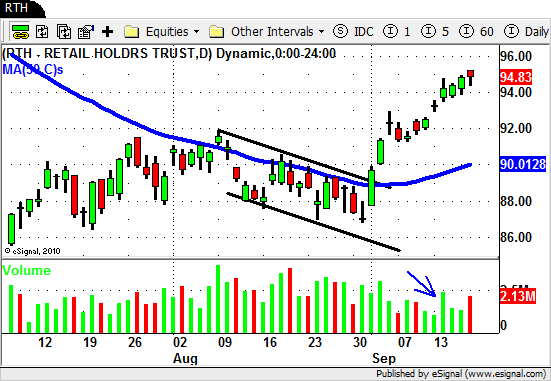
RTH

With the extreme upward angle of this last move and possible overhead resistance in the $94-$96 area RTH is short term overbought just like the overall market.


Take caution going into next week but continue to watch this sector moving forward once the market has pulled back a bit.

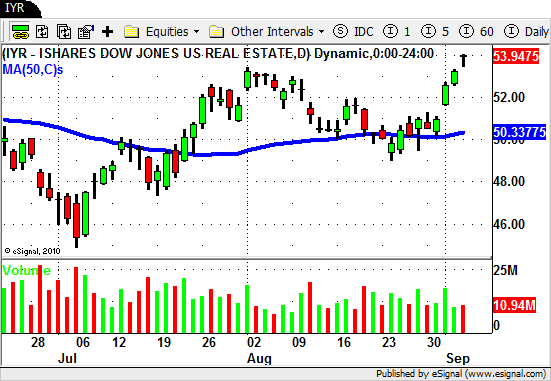
The Real Estate ETF (IYR) is holding up nicely but consolidated this entire week.

Breakout or pullback?

Keep this one on your radar as well in the coming days.
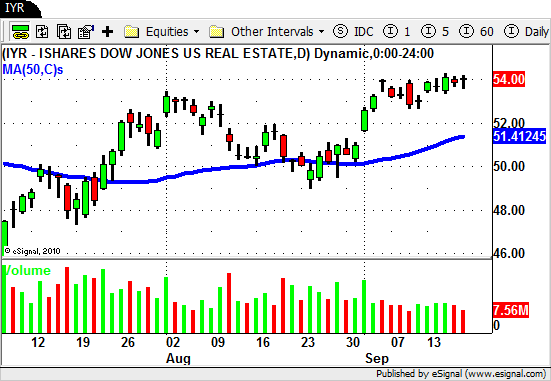
IYR

The notable laggard (so far) is still the Semiconductor sector ETF (SMH).

The week's upward drift still leaves this weak ETF trading below its 50 day SMA while almost every other sector is trading back above theirs.
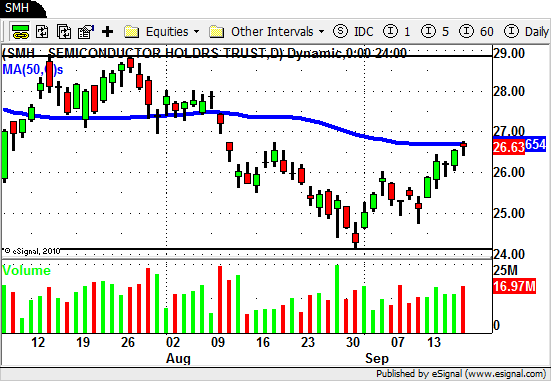
SMH

CREE, CRUS, SNDK (although it stopped us out last week) and a few other names in this sector still have very weak charts.

This could all change in the near future especially if the overall market continues to strengthen.

The big picture tells us that the overall action in the market remains sideways.

The recent strength does look favorable for a continued UP move in the market after we digest some of these recent gains.

BUT…

We have seen this a few times before on both the LONG and SHORT side of the market.

Don't get to comfortable with this market just yet by only staying focused on one way trades.

Be prepared for anything (have LONG and SHORT ideas) that way whatever the market decides to do from here you can take the appropriate action.

Until next week…Good Trading to YOU!


Swing Trading Week in Review – September 3, 2010

Sunday, September 5th, 2010

Swing Trading Blog Post-

What a difference a week makes.

In last week's BLOG post we told that their were buyers at the 10,000 level in the DJIA.

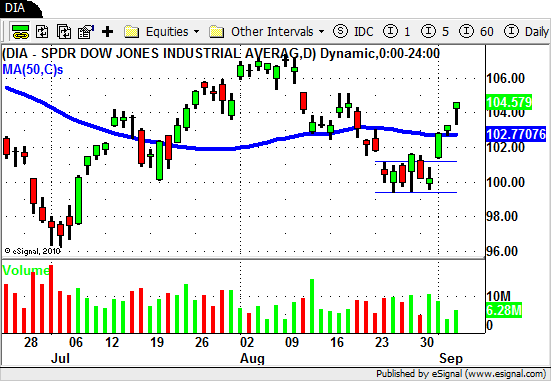
We saw the buyers step in and hold the market up last week and again on Monday and Tuesday of this week.

Wednesday is when the real fun started.

After a big GAP UP Wednesday morning we saw the market rally the rest of the day to finish just off the high of the day.

Thursday brought more of the same and then the GAP UP, sell off and intraday reversal during Friday's session is a clear sign that buyers were in control.

DIA - Swing Trading DIA

The market continues it's erratic behavior and if you have trading for any amount of time you know that the month of September is likely to bring more of the same.

Last week we posted about the strength in the Agriculture related ETF's…DBA and MOO.

We gave you the "head's up" to watch this sector as it seemed ready for it's next move to the UP side.

Both ETF's followed through nicely this week as the market pushed higher to end the week.

DBA - Swing Trading ETF MOO - ETF Swing Trading

Several of the other "strong" ETF's rallied to new multi month highs this week.

The Real Estate (IYR) and Utilities (XLU) are on this list as well as a few International ETF's like THD and BZF.

IYR - Swing Trading ETF

We also saw the Energy (XLE) and Retail (RTH) ETF's break their short term down trend lines.

XLE - Swing Trading ETF RTH - Swing Trading ETF

The weak sector's we identified last week…the Semiconductor's and FInancial's…put in a decent bounce off of their recent low's.

We wondered last week if these sector ETF's were going to "bounce" back to their 50 Day SMA's or if they were ready to push to NEW LOW'S.

We got our answer although the "bounce" in the semiconductor's was really less than impressive.

The last 3 trading sessions have taken the market and several stocks to near short term "over bought" levels.

We are not going to chase the market at this point and will simply wait for the next opportunity to initiate some trades.

We will let our current  trades play out and manage our positions accordingly.

September is notorious for being a slow, choppy month for trading so be patient and wait for your ideal setups to get into the market.

Until next week...Good Trading to YOU!

Swing Trading Week in Review – July 2, 2010

Saturday, July 3rd, 2010

In last weeks Swing Trading BLOG post we said that this would be a pivotal week in the market.

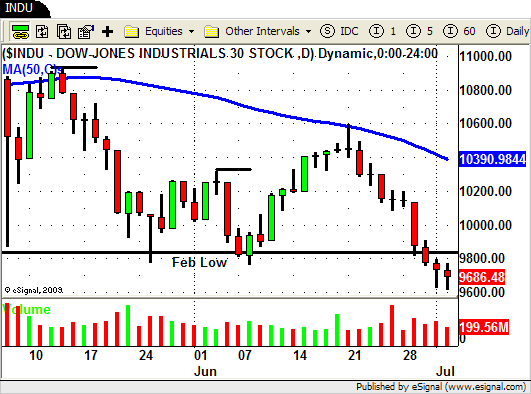
Well after the dust settled this week it was VERY CLEAR that the BEARS are in charge!

After Monday's "inside day" price action and volume spoke LOUD and CLEAR on Tuesday as the market gapped down and continued to sell off until the week came to close on Friday.

DJIA

The last few weeks have been tough for Swing Traders and this week was no exception.

This week was tough for Swing Traders for a few reasons:

Starting in early June we had nine days where we basically went straight up and now we have had about ten days of trading where the market has gone straight down!

If you are "pullback" trader like we are there has not been many chances over the past month or so for you to implement your trading strategy.

If you did  not have a plan in place and were NOT prepared for Tuesday then you may have "missed the boat" when the market gapped down and sold off for the rest of the week.

This has been a "fast market" and by that we mean that there ARE chart patterns and pullbacks to trade BUT these pullbacks are shallow, maybe a day or so, and then they continue to move.

This type of price action creates "fast" trend channels and for most traders these are much more difficult to identify and trade.

Lets take a look at some of the stocks we have been following lately to show you what we mean.

Last week we walked you thorough our entry into Nemont Mining (NEM) on a LONG Swing Trade.

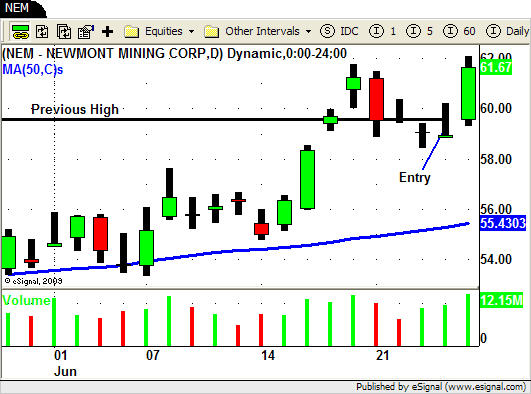
This is the chart from last week.

NEM - Long Swing Trade

As we told you we were able to exit some of our position at $61.67 during last Friday's afternoon rally and we were holding on to the rest with a trailing stop.

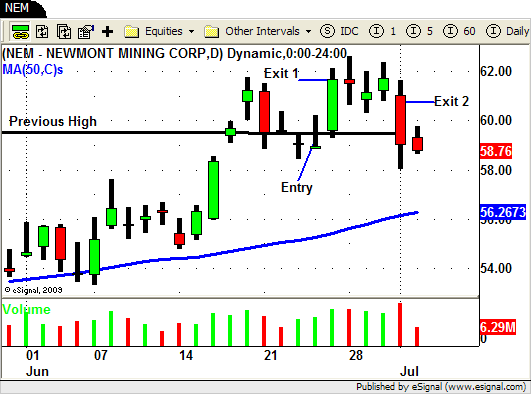
Here is how the chart looks at the end of this week.

NEM - Long Swing Trade

NEM broke out to NEW HIGHS last week so we were expecting some type of follow through to the UP side this week.

Monday NEM stalled and was followed by two days (Tuesday and Wednesday) of slightly UP price movement combined with decreasing volume.

This combination should be a BIG FLASHING YELLOW LIGHT to you just as it is for us.

Our trailing stop was hit at $60.75 on Thursday as NEM traded down through the low of the previous day.

We have marked both of our exits (Exit 1 and Exit 2) on the chart above.

Still a profitable trade but not what we expect from a stock breaking out to new highs.

At pivotal times in the market we often have a few LONG positions and a few SHORT positions and more often than not we get stopped out of the trades that end up being on the wrong side of the market.

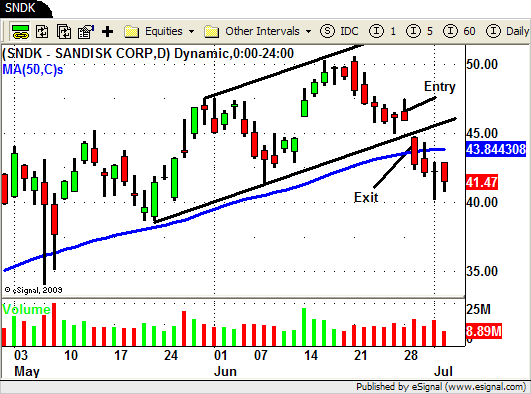
One of our losing trades (we had a few) this week was in Sandisk (SNDK).

Here is the chart of SNDK to give you the context…strong stock making higher highs and higher lows.

SNDK - Long Swing Trade

During this weeks trading action MONDAY was the make it or break it day in our opinion.

We have been following the recent strength in SNDK so after last weeks pullback we were ready to get LONG again on the first sign of strength.

Monday we got what we were looking for as SNDK traded through Fridays high just as the market also attempted to trade higher.

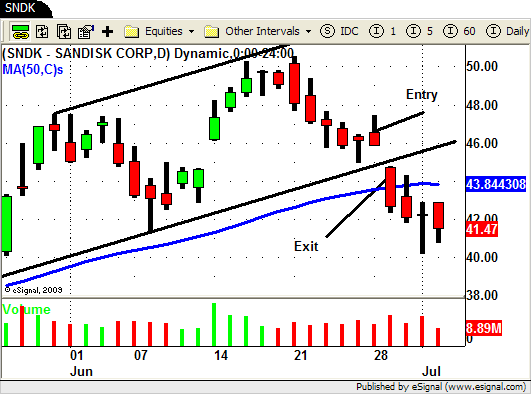
Our entry was triggered at $47 and our initial stop was set at $44.92 for a $2.08/share risk.

When the market did not follow through on Monday SNDK reversed midday and ended right at the low of the day.

One of the hardest situations that Swing Traders face is what to do when you have a BIG opening gap (up or down) in the market.

Tuesday morning that is exactly what the market did as it opened up the day down significantly from Mondays close.

Like most stocks SNDK was no exception and gapped down with market and opened at $44.76 which was BELOW our initial stop.

Our exit strategy when this happens is dependent on the context of the overall picture that the market, sector and individual stock is painting.

in this specific example the strategy calls for an exit on the open for a number of reasons.

Our actual exit price was $44.74 so we actually lost  $2.26/shareMORE than initially planned.

Here is a zoomed in version so you can see the details a bit better.

SNDK - Long Swing Trade

This losing trade in SNDK shows you why having a position sizing and money management strategy in place is so important.

Due to the frequent overnight gaps we face as swing traders we recommend that you have a "buffer" built in to your position sizing strategy to allow for a "worst case" scenario.

When strong stocks like ALK, NTAP, SNDK and MELI start to break down at pivotal times that usually means our SHORT positions (weak stocks or ETF's) are continuing to sell off.

The "weak" Retail (RTH) ETF continued its sell off this week but you almost had to be in this position coming into the week.

The other noticeably weak sector, the Homebuilders (XHB), offered you yet another opportunity to get SHORT as it broke to NEW LOWS on Tuesday's "gap and go".

Other SHORT trades that worked out nicely were LPNT, ERTS, X, and MGM.

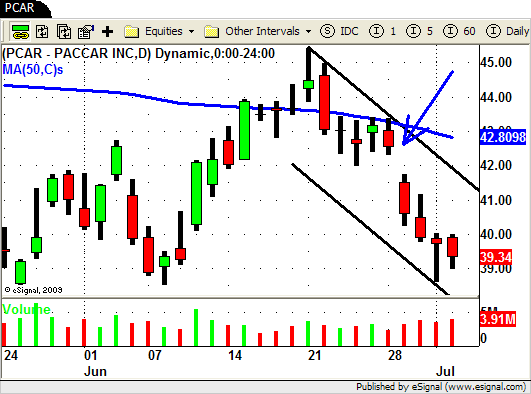
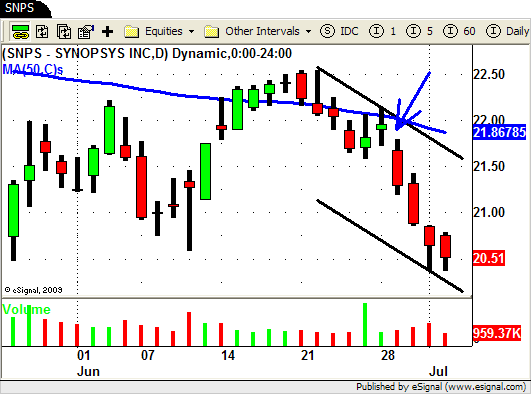
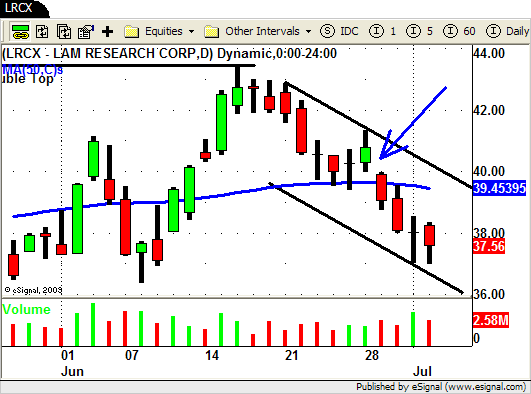
I mentioned above about this being a "fast" market and here are a few example of stocks with "fast channels" to demonstrate my point.

PCAR - Fast Trend Channel SNPS - Fast Trend Channel LRCX - Fast Price Channel

In all of the charts above you can see that after pulling back from their recent highs all of them attempt to move higher on Monday.

They all fail to move higher the next day essentially creating a one day UP move before continuing to sell off.

If they all would have moved higher for another day or so the chart pattern would have painted a more clear picture for those traders not yet skilled at identifying this type of "fast" trend change.

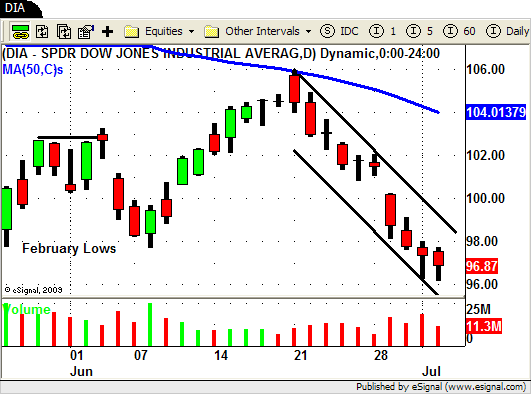
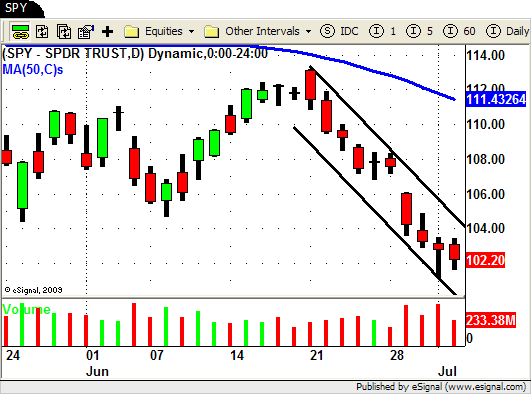
Probably the best example of just how 'fast" this market has been is to look at the overall market ETF's for the DJIA (DIA) and the S&P 500 (SPY).

DIA - Swing Tading ETF SPY - Swing Trading ETF

You can see how the market sold off everyday last week as it put in its first pullback after the 9 day up move.

Monday you can see how price "stalls" and creates an inside bar.

Tuesday the market "gaps down" and sells off for the rest of the week not giving swing traders much of a pullback to SHORT.

In order to capitalize on this type of "fast" price action you need to learn how trends transition and use price action and volume as your leading indicators.

These are the exact strategies we teach in our PVT Trading Tactics class so if you would like to learn more you can check it out HERE.

Until next week…Good Trading to YOU!


Swing Trading Week in Review – June 25, 2010

Friday, June 25th, 2010

Swing Trading Blog Post-

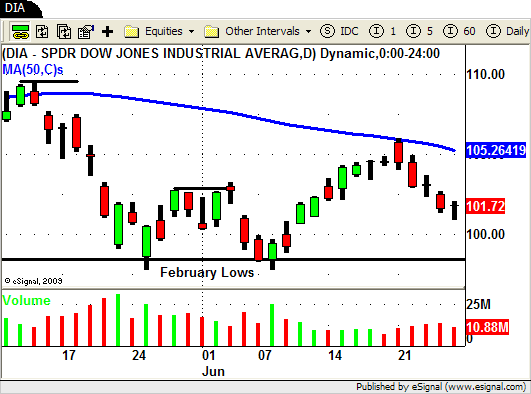
Well after the markets last "mini" rally off of the February lows that market finally put in long awaited and much anticipated pullback this week.

DIA - Diamonds ETF

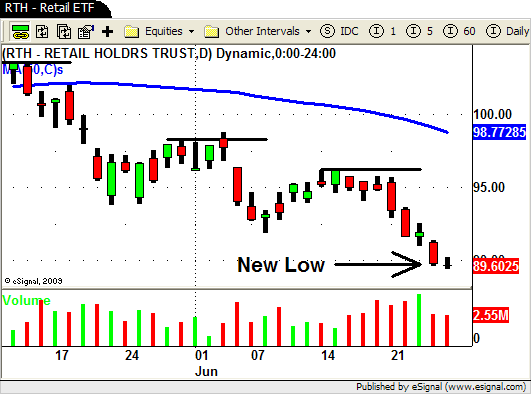
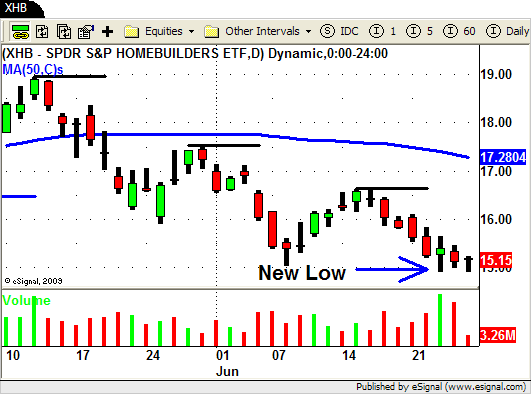
The two "weak" sectors, Retail (RTH) and the Homebuilders (XHB), we highlighted in last weeks BLOG POST (and in last Friday nights webinar) sold off nicely and actually made NEW LOWS as the market pulled back this week.

RTH - Retail ETF XHB - Homebuilders ETF

Coming into this week there were several SHORT Swing Trade setups in some of the stocks the these "weak" sectors.

WSM, WMT, JCG, ANF and many others were on our SHORT Watch list this week and they all moved nicely to the down side.

The "strong" stocks we talked about last week (AKAM, ALK, NTAP) all pulled back with the overall market this week.

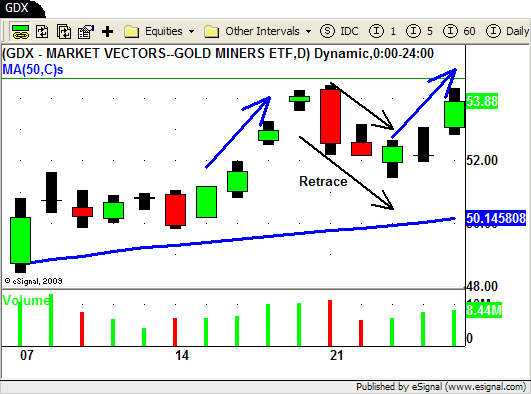
The strongest sector we discussed at the webinar last Friday was GOLD and the GOLD MINERS.

After a nice run up last week you saw most of the stocks and ETF's in this sector put in a short retrace from Monday through Wednesday this week.

GDX - Gold Miners ETF

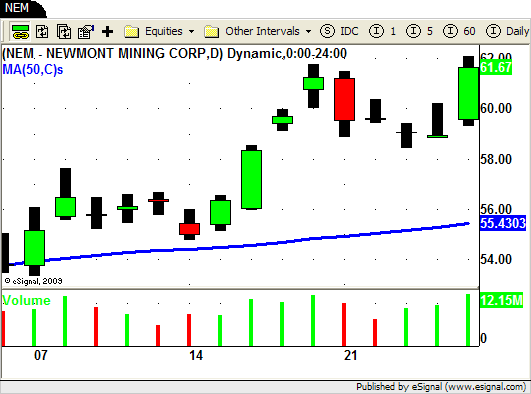
On Thursday we got our entry signal for several stocks but lets take a look at Newmont Mining (NEM) since this stock seemed to be the leader of the pack in the last UP move.

NEM - Long Swing Trade

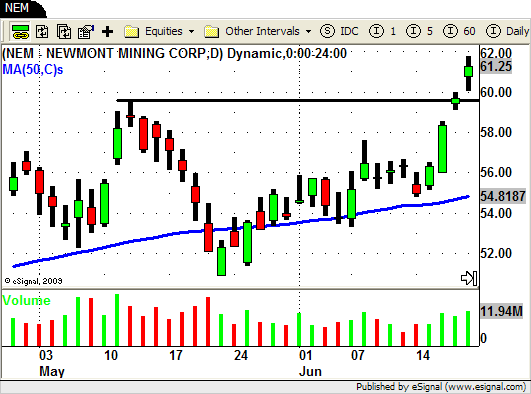
NEM BROKE OUT to new multi-year highs last week so were "stalking" this stock waiting for another opportunity to GET LONG after a decent pullback.

Here is how the chart looked last Friday.

NEM - Long Swing Trade

After this nice strong UP move through the previous high (black line) we waited for the first pullback.

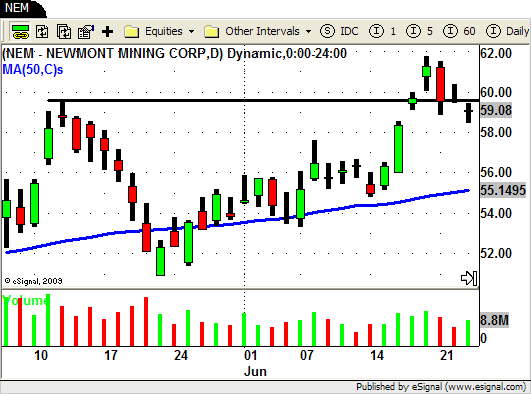
That pullback started on Monday and we watched price firm up a bit by the close on Wednesday as it traded around the area of the previous high.

We were watching this previous "resistance" level to now become the new "support" level.

NEW - Long Swing Trade

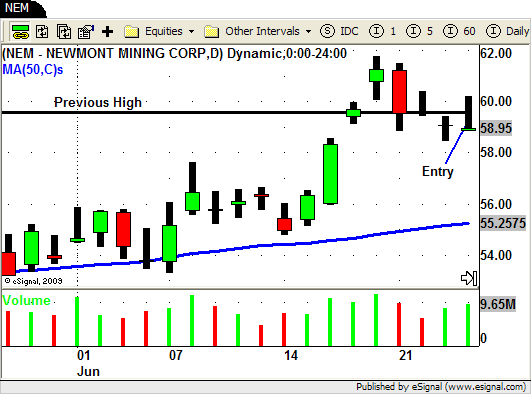
We still need price action to confirm that this area would hold as "support" and we received this confirmation on Thursday morning.

Right out of the gate on Thursday NEM traded through the high of the previous day ($59.43) giving us an entry signal at $59.45.

NEM moved up for most of the morning only to close the day well below the open.

Another intraday reversal!

Here is how the chart of NEM looked by the close of the trading day on Thursday.

NEM - Long Swing Trade

Price and volume were both increasing but the end of day reversal made it a little tougher for us to determine if the volume was bullish or bearish.

The next day we needed to see the signs that NEM was going to move higher.

Today (Friday) we got exactly what we needed from NEM.

Price moved higher on increasing volume throughout the day.

NEM - Long Swing Trade

Early this afternoon we were able to piece out of some of our position in NEM at the $61.67 level.

We are trailing our stop in NEM based on our BREAKOUT strategy rules and will exit the rest of our position just as our plan and this strategy dictates.

NEM is breaking out to NEW HIGHS once again and the sector as a whole is showing some tremendous strength so we are hoping to see some nice follow through next week.

Speaking of next week it seems that we are really at a pivotal point in the overall market.

We have taken out the last "swing high' and rallied up to (but still under) the 50 day SMA.

We are now in the process of pulling back from the high of the recent up move.

Another run up towards the 50 day SMA wouldn't surprise us at all.

On the flip side though there are still a lot of "weak" looking chart patterns and a some stocks and sectors making NEW LOWS.

So what is a SHORT TERM TRADER to do?

Be prepared for anything!

You have heard that somewhere before right? (this BLOG over and over and over)

As always we will have a list of STRONG and WEAK stocks and sectors on our Watch list  for Monday.

That way no matter what the market decides to do we can take the appropriate action and get ourselves on the right side of the market.

Until next week…GOOD TRADING TO YOU!

P.S. Feel free to join us Friday July 2nd at 6pm for our next "Weekly Wrap Up" webinar.

You can click HERE to register!

© Swing Trading Boot Camp 2024