Swing Trading BLOG – Swing Trading Boot Camp
The UPWARD drift continues!
In last week's BLOG POST we mentioned the lack of volume we are seeing and the need for volume to increase to move this market decisively higher.
Well the market did move up this week but as the first line of this post states it was more of a drift than a significant move.
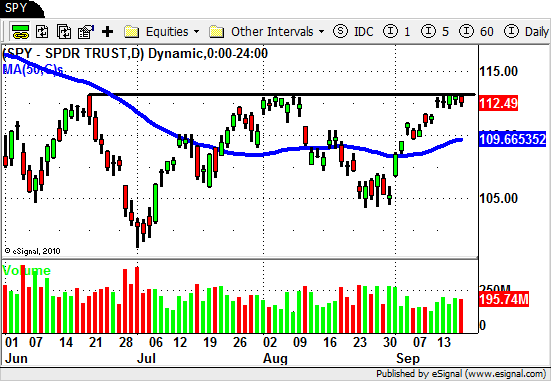
The move this week puts us right back up to the June 21st price levels that we saw just prior to the sell off that took us to NEW LOW'S for the year.
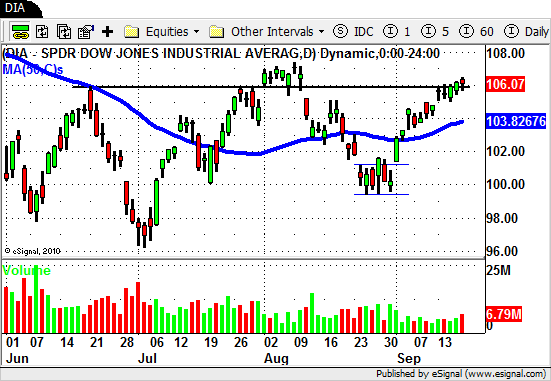
The best chart that illustrates the larger sideways trading channel we are in has to be the chart of the S&P 500 Index.
Here is the chart for the SPY to show how this weeks trading action brings us right to very top of this channel.
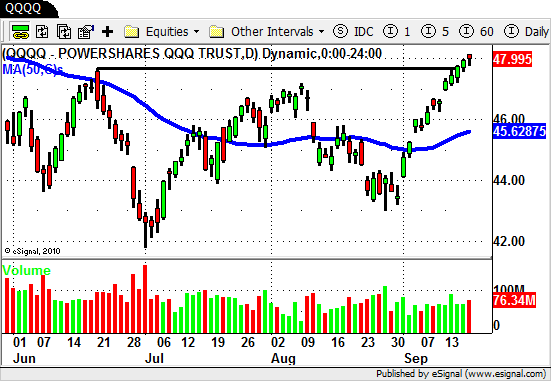
The Nasdaq has actually been a bit stronger.
This most recent UP move brings to QQQQ'S above that all important level set on June 21st but after a 12 day up move it seems way overbought in the short term.
As far as sectors go it is pretty much the same story as last week.
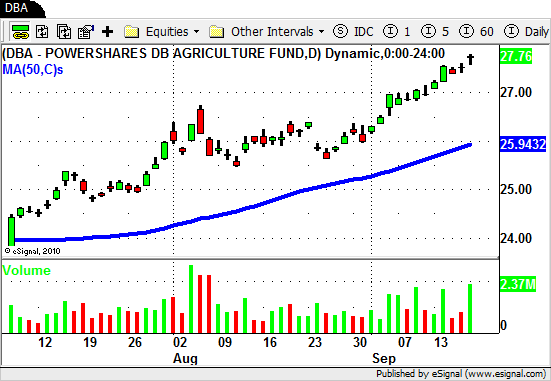
The Agriculture ETF's (DBA and MOO) remain strong with several stocks in this sector pushing higher this week.
DBA actually pushed to a NEW HIGH for the year this week while MOO trades a bit below its yearly high.
In last week's post we mentioned a few stocks to watch in this sector coming into this week.
One of the few trades we made this week was in John Deere & Company (DE) which is one of the biggest holdings in MOO.
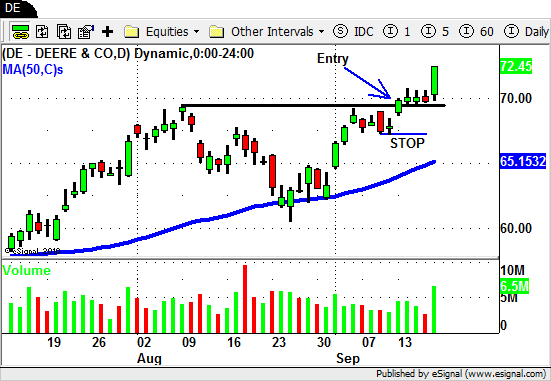
After showing so much recent relative strength DE put in a nice tight sideways consolidation pattern last week.
As the market GAPPED UP on Monday DE was up right along with it.
Our original entry target was just above the high set in early August which was $69.47.
When the market rolled over mid morning DE stayed strong as we entered into a position at $69.55.
Our initial STOP LOSS level is set at $67.10 which is just below the recent consolidation area.
This puts our initial risk at $2.45/share.
Our PROFIT TARGET is set at $74.45 which is twice our initial risk per share ($2.45 x 2= $4.90 + $69.55).
After 3 more days of consolidation DE made a HIGH VOLUME UP MOVE today and finally pushed our position nicely to the UPSIDE.
The trade is still open so we will manage our position accordingly and let you know how it turns out.
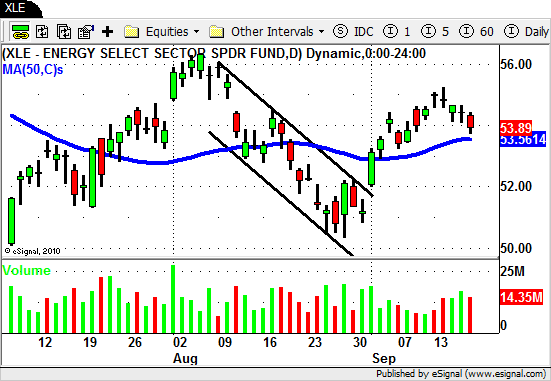
As far as the other sector's in the market go we cautioned you last week about the LOW VOLUME moves in XLE and RTH.
XLE actually put in a retrace this week despite the strength in the overall market.
RTH on the other hand GAPPED UP nicely with the market on Monday and then followed WITH VOLUME on Tuesday.
A nice move UP since breaking the DOWN TREND channel line.
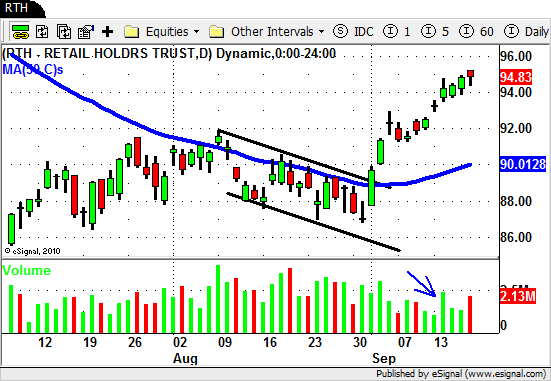
With the extreme upward angle of this last move and possible overhead resistance in the $94-$96 area RTH is short term overbought just like the overall market.
Take caution going into next week but continue to watch this sector moving forward once the market has pulled back a bit.
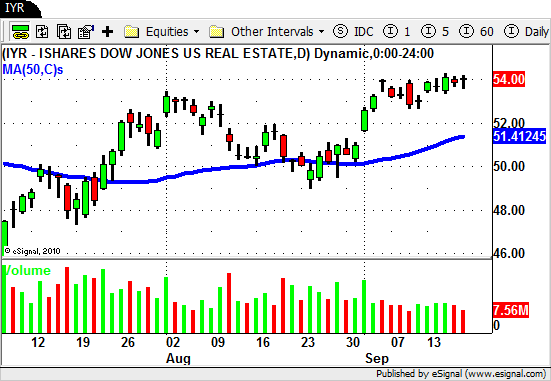
The Real Estate ETF (IYR) is holding up nicely but consolidated this entire week.
Breakout or pullback?
Keep this one on your radar as well in the coming days.
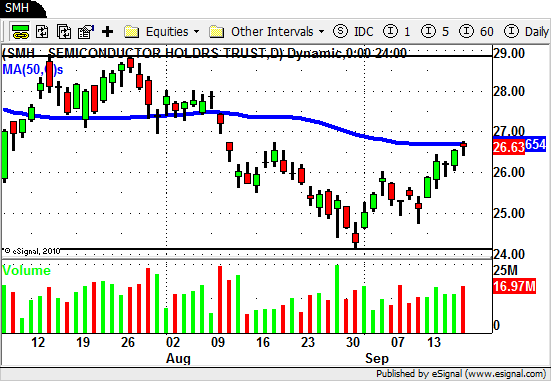
The notable laggard (so far) is still the Semiconductor sector ETF (SMH).
The week's upward drift still leaves this weak ETF trading below its 50 day SMA while almost every other sector is trading back above theirs.
CREE, CRUS, SNDK (although it stopped us out last week) and a few other names in this sector still have very weak charts.
This could all change in the near future especially if the overall market continues to strengthen.
The big picture tells us that the overall action in the market remains sideways.
The recent strength does look favorable for a continued UP move in the market after we digest some of these recent gains.
BUT…
We have seen this a few times before on both the LONG and SHORT side of the market.
Don't get to comfortable with this market just yet by only staying focused on one way trades.
Be prepared for anything (have LONG and SHORT ideas) that way whatever the market decides to do from here you can take the appropriate action.
Until next week…Good Trading to YOU!

