Swing Trading Blog Post-
Well after the markets last "mini" rally off of the February lows that market finally put in long awaited and much anticipated pullback this week.
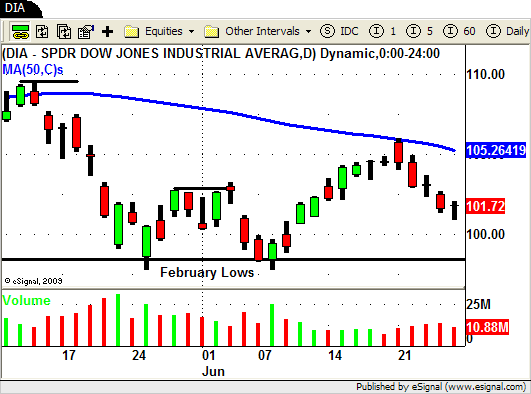
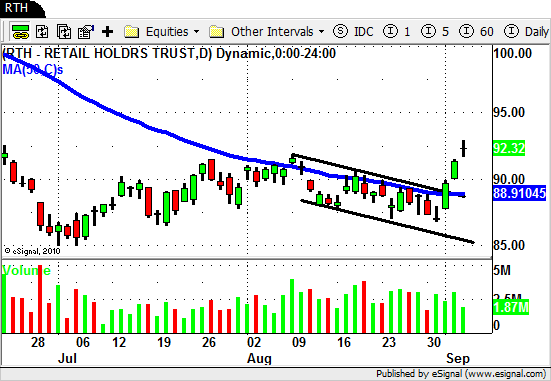
The two "weak" sectors, Retail (RTH) and the Homebuilders (XHB), we highlighted in last weeks BLOG POST (and in last Friday nights webinar) sold off nicely and actually made NEW LOWS as the market pulled back this week.
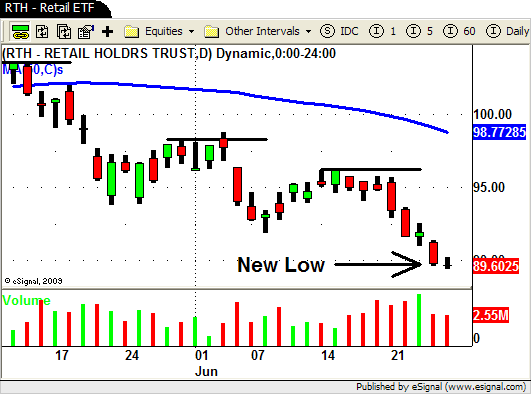
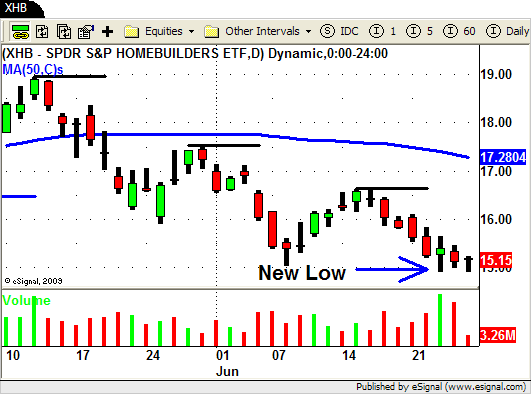
Coming into this week there were several SHORT Swing Trade setups in some of the stocks the these "weak" sectors.
WSM, WMT, JCG, ANF and many others were on our SHORT Watch list this week and they all moved nicely to the down side.
The "strong" stocks we talked about last week (AKAM, ALK, NTAP) all pulled back with the overall market this week.
The strongest sector we discussed at the webinar last Friday was GOLD and the GOLD MINERS.
After a nice run up last week you saw most of the stocks and ETF's in this sector put in a short retrace from Monday through Wednesday this week.
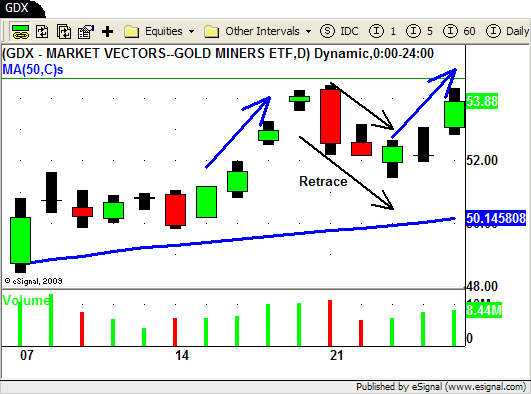
On Thursday we got our entry signal for several stocks but lets take a look at Newmont Mining (NEM) since this stock seemed to be the leader of the pack in the last UP move.
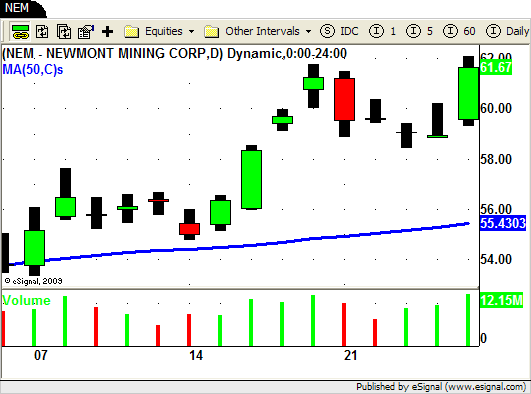
NEM BROKE OUT to new multi-year highs last week so were "stalking" this stock waiting for another opportunity to GET LONG after a decent pullback.
Here is how the chart looked last Friday.
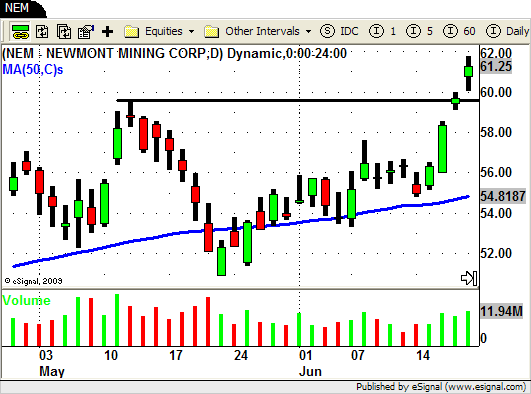
After this nice strong UP move through the previous high (black line) we waited for the first pullback.
That pullback started on Monday and we watched price firm up a bit by the close on Wednesday as it traded around the area of the previous high.
We were watching this previous "resistance" level to now become the new "support" level.
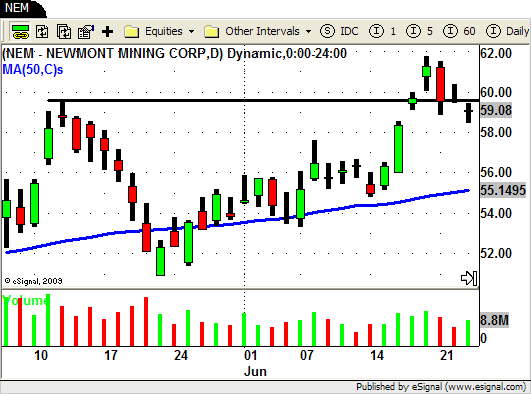
We still need price action to confirm that this area would hold as "support" and we received this confirmation on Thursday morning.
Right out of the gate on Thursday NEM traded through the high of the previous day ($59.43) giving us an entry signal at $59.45.
NEM moved up for most of the morning only to close the day well below the open.
Another intraday reversal!
Here is how the chart of NEM looked by the close of the trading day on Thursday.
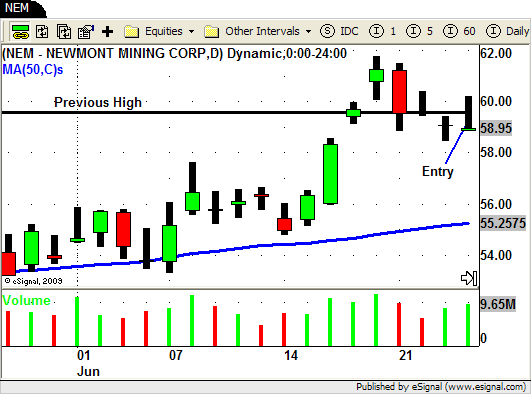
Price and volume were both increasing but the end of day reversal made it a little tougher for us to determine if the volume was bullish or bearish.
The next day we needed to see the signs that NEM was going to move higher.
Today (Friday) we got exactly what we needed from NEM.
Price moved higher on increasing volume throughout the day.
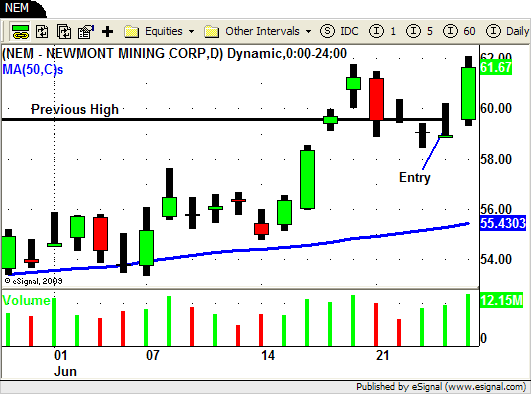
Early this afternoon we were able to piece out of some of our position in NEM at the $61.67 level.
We are trailing our stop in NEM based on our BREAKOUT strategy rules and will exit the rest of our position just as our plan and this strategy dictates.
NEM is breaking out to NEW HIGHS once again and the sector as a whole is showing some tremendous strength so we are hoping to see some nice follow through next week.
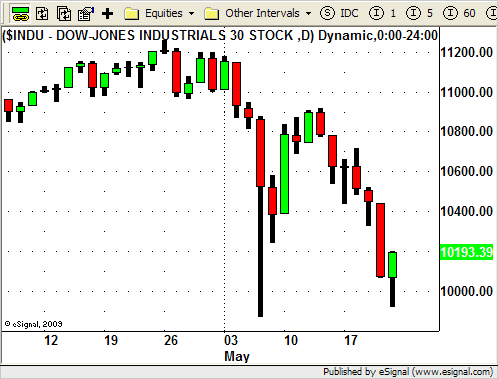
Speaking of next week it seems that we are really at a pivotal point in the overall market.
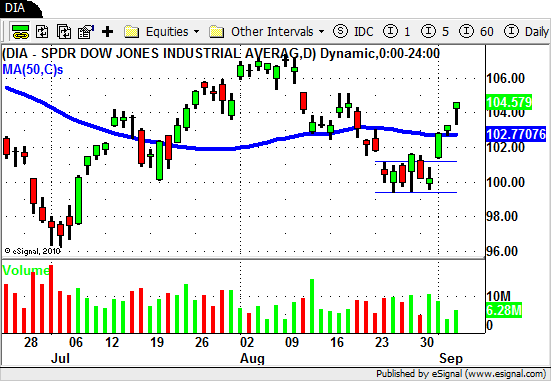
We have taken out the last "swing high' and rallied up to (but still under) the 50 day SMA.
We are now in the process of pulling back from the high of the recent up move.
Another run up towards the 50 day SMA wouldn't surprise us at all.
On the flip side though there are still a lot of "weak" looking chart patterns and a some stocks and sectors making NEW LOWS.
So what is a SHORT TERM TRADER to do?
Be prepared for anything!
You have heard that somewhere before right? (this BLOG over and over and over)
As always we will have a list of STRONG and WEAK stocks and sectors on our Watch list for Monday.
That way no matter what the market decides to do we can take the appropriate action and get ourselves on the right side of the market.
Until next week…GOOD TRADING TO YOU!
P.S. Feel free to join us Friday July 2nd at 6pm for our next "Weekly Wrap Up" webinar.
You can click HERE to register!
