What a way to end the week!
The indexes all closed DOWN on HUGE VOLUME today…The Dow closed down -100.90 (-0.94%), while the S&P 500 lost -12.42 (-1.08%), and the Nasdaq finished down -28.75 (-1.24%).
Some of the strongest stocks (CREE, MRVL, DE, RIG, APC, X, CAT) followed suit also trading significantly lower on heavy volume.
We were able to lock in our profits from last weeks swing trades by being prepared for a move we somewhat anticipated.
So what were the clues?
Well take a look at this weeks price action.
After last weeks strong up move you have to expect a pullback in the market.
Monday and Tuesday saw they S&P and Nasdaq pullback a bit while the Dow held pretty steady.
Monday we did note that some of last weeks strongest ETF's (OIH, XLE, SLX) gapped up on Monday and then sold off to finish near their lows.
The strong stocks also pulled back a bit as expected.
Nothing too alarming but a clue to POSSIBLE things to come.
The next few days painted a different picture from the previous up move.
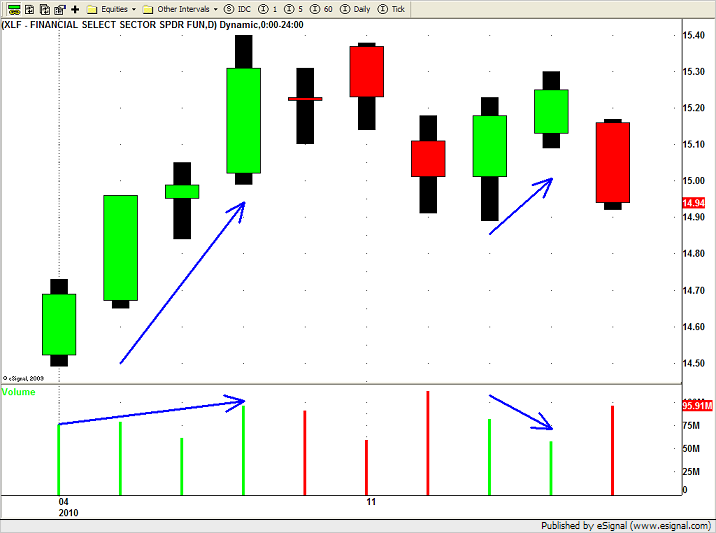
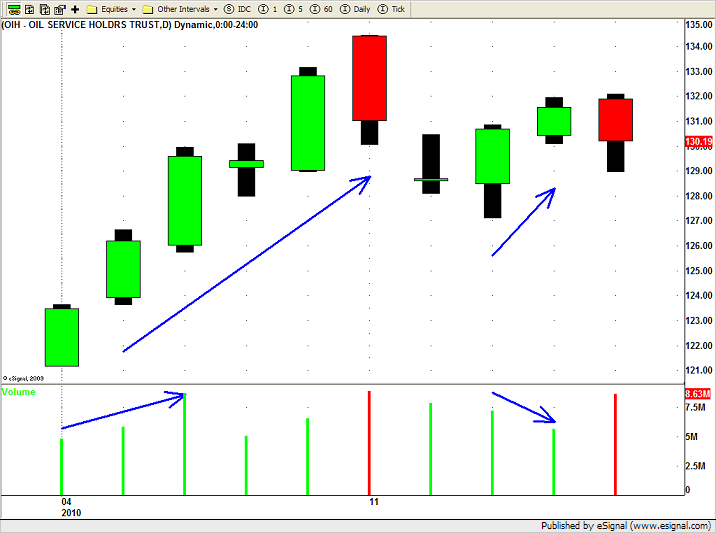
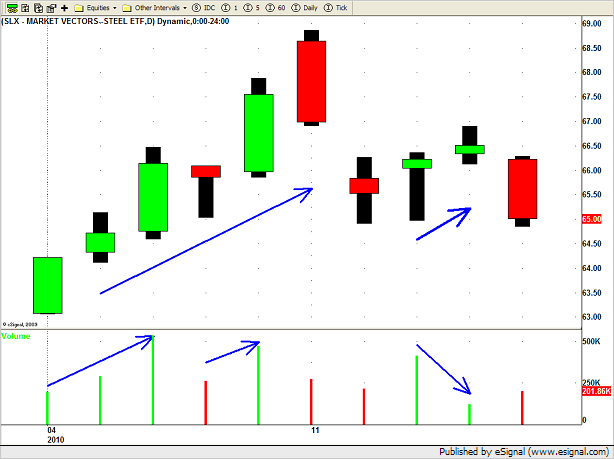
One of the things we noticed that really stood out on Wednesday and Thursday was the amount of stocks and ETF's that were pushing higher on DECREASING VOLUME!
Take a look at the chart patterns to see what we mean.
Here is XLF (Financial ETF)…

And the OIH (Oil Services ETF)…

And finally the SLX (Steel ETF)…

Now you can see how they all attempted to move higher on DECREASING volume.
Dominant moves (UP in this case) on LOWER VOLUME should turn on the CAUTION light for you.
If you pull up some of the individual stocks you will notice the same chart patterns.
Stocks like DO, RIG, APC, MEE, WFC, JPM and X all have similar stories.
Once we noticed the signals that PRICE ACTION and VOLUME gave us we were a little cautious getting overly LONG.
Now, no one can predict the future, and POSITIVE volume could have come back into the market the next day so we were prepared if that would have been the case.
We held our remaining LONG positions and actually added 2 more during this time however we DIDNT LOAD THE BOAT!
When todays (Friday) sell off happened we were well prepared.
We tightened up our stops on our LONG positions and when we were stopped out of some of them today we were able to hold on to our hard earned swing trading profits!
Now that being said the market could do an about face on Monday and head right back up.
But at least for now we locked in our profits and have no problem entering into new LONG positions if the market take off again.
When you see LOWER volume UP moves it means you need to start paying very close attention!
It does'nt mean to EXIT your positions or start shorting strong stocks in a strong market but it does tell you that things MAY, and I repeat MAY, change.
Once you see the warning sign it prepares you to TAKE ACTION if price action confirms the change (like it did today).
We like to see price action AND volume working together we we enter into our trades.
UP moves (in this case) on strong volume and pullbacks on lower volume.
When the two dont match up they are telling you something…WARNING WARNING…Sentiment MAY change here (even temporarily) so HEADS UP!
By learning to read and interpret price action, volume and chart patterns together you can see the "big picture", that way you are always prepared to take whatever action the market calls for.
Until Next week…Good Trading to You!
