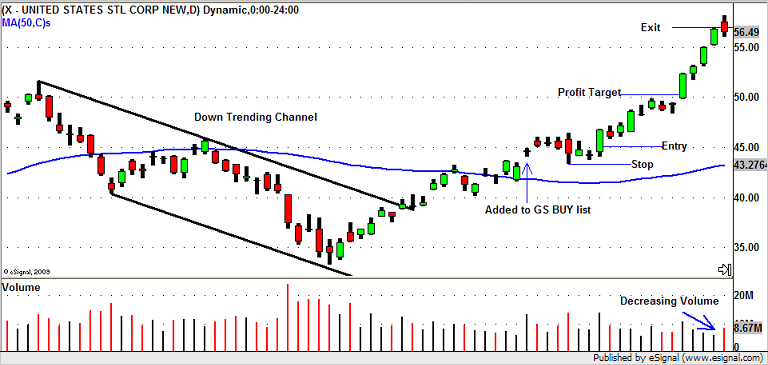
Swing Trading Case Study
Our LONG trade in U.S. Steel (X)
In this case study I will walk you through a recent trade we made in U.S. Steel.
We started to watch "X" in early November when it broke its intermediate term down trend line.
Prior to that "X", and the entire group of steel stocks, were noticeably weaker than the overall market.
Due to this weakness and the fact that "X" was still trading below its 50 period SMA we werent ready to initiate a LONG trade just yet.
For the rest of November the market and "X" pretty much traded sideways until the very end of the month.
Then when Goldman Sachs came out on the 30th and announced that "X" would replace "FCX" on their BUY list we started to really focus on "X" and the group as a whole.
When the market started having trouble breaking out to new highs in early December we paid special attention to "X".
When the market pulled back from December 3rd to December 8th we noticed how well "X" held up and began to show some relative strength.
After finding a nice support level during this pullback the market stated to firm up and began to make its next run towards new highs.
On December 9th we initiated a LONG trade in "X" at $45.07.
We set our initial STOP LOSS level at $43.30 based on the pullback low of December 4th which coincided with the 10 period ATR of $1.75.
We set our initial PROFIT TARGET level at $50.25.
This level was set based on a number of things.
1. Overhead resistance near the $50 level
2. $50 Whole number selling
3. It fit nicely into our 3-1 risk/reward ratio
In this trade we were risking 1 ATR ($1.75) with a profit target at almost 3 ATR's ($5.25).
"X" finished up nicely on our entry day on strong volume and near the high of the day.
It moved up to $46.84 which allowed us to move our stop up to break even since it moved in our favor the amount of our initial risk.
For the next few days "X" ran up nicely to just under $50 ($49.88) but once again the market began to struggle through new highs.
During the 3 day pullback from December 16th through December 18th "X" stayed strong and didnt even pullback 1 whole ATR!
Needless to say our trailing stop was never hit and we held the trade LONG.
On December 21st "X" gapped up a bit and then ran straight to our profit target…$50.25.
Since "X" was showing such strength we decided to hold through the first consolidation "X" made in the morning.
We set our "out" at $50.24, only one penny below our original target, based on the chart pattern.
"X" quickly broke out to the upside and never looked back the entire day closing at $52.35, near the high of the day, again on strong volume.
For the next 3 days "X" moved up very nicely despite the markets lackluster advance.
But we noticed that the up move in "X" was on DECREASING volume.
A possible warning sign that "X" may be ready to take a little break.
On December 28th "X" opened strong but quickly began to head south making a morning low of $57.10
We decided to move our stop up to just under this level to $57.
Midday "X" started to break down and finally stopped us out at $57 and we finally got out of our "X" swing trade for a profit of nearly $12!
This trade lasted 13 days which is much longer than our typical swing trade but by observing the market conditions we were able to hold on for a very big winner!

