Archive for the ‘Technical Analysis’ Category

Swing Trading BLOG – Week in Review – July 1, 2011

Monday, July 4th, 2011

Swing Trading BLOG – Swing Trading BOOT CAMP
$DIA - Swing Trading ETF

WOW!

What a bounce we saw in the market this week!

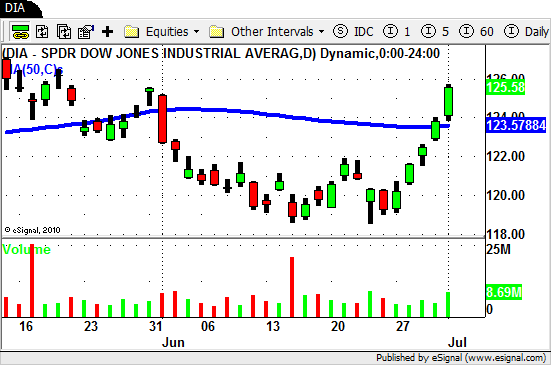
After putting in a short term "double bottom" pattern last week traders watched as the market RIPPED up for 5 consecutive days this week!

After talking and emailing several traders this weekend it seems that a lot of people were caught off guard.

I sat with one trader after the market close on Friday and he sat there trying to convince me that the market SHOULD not have bounced so hard.

He also told me about how his positions (mostly shorts) SHOULD have acted during a bounce.

After finally revealing that he was still SHORT (after most of his positions were now very much against him) it is apparent that he himself SHOULD have done a few things.

The most important thing to get out of this little story is have a sound set of trading rules in place and stick to them no matter what.

What you or I (or anyone else) think the market SHOULD do DOESN'T MATTER and that way of thinking has absolutely has no place in trading.

As traders we look for opportunities to profit from what we think the market MAY do.

We also know that once we enter into a trade it MAY NOT do what we had hoped for.

We as traders expect to be wrong often.

They key to success is understanding this and PROTECTING YOUR CAPITAL at all costs when you are wrong!

If you read our Swing Trading BLOG 9and we hope you do) you will tell our traders to "prepare for whatever the market decides to do and act accordingly".

That means be prepared and have a plan for action whether the market does what you expect or not.

Being stubborn and trying to out think the market is a sure way to trading disaster…trust me!

Ok so now that the lecture is over lets take a look at the charts!

Almost everything on the board RIPPED right along with the market this week.

The most important lesson to gain from looking at the charts is to learn how to spot when the SHORT TERM trend changes.
$DIA

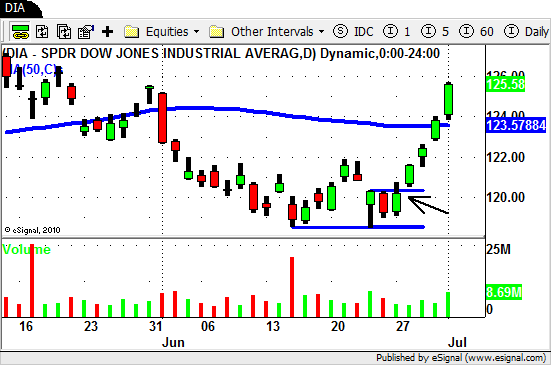
Let's take a look at the chart of the "Diamonds" above.

Last Thursday (June 23rd) we saw a big gap down in the AND reversal in the market.

The SELL OFF that day took the market down to an area that was near the low we saw on June 15th.

Once the market traded down to that level the market "reversed" and closed very near the high of the day.

Friday (June 25th) the market didn't do much as it traded sideways on low volume.

It is at this point that we as traders look for signs or clues to see what the market has in store next.

Monday we watched as the market traded higher (albeit or lower volume) which is not a good sign for the SHORTS.

If after seeing a strong reversal followed by a sideways trading day and UP day in the market doesn't give you a very loud hint that a retrace is upon you then I am not sure what will!

Tuesday the market GAPS UP (another clue) and trades in an nice orderly up trend all day (yet another clue).

Once you notice all the clues or hints you need to take action based on your observation.

For some of you that action meant to cover your SHORTS at a loss.

For others it meant to cover and GET LONG.

Our trading plan may not match you trading plan.

Our plan has us stopping out of our SHORTS and entering into some LONG positions in STRONG STOCKS.

In last weeks BLOG POST we mentioned some of the STRONG STOCKS that we were watching this week.

Take a look at the charts of the stocks we mentioned in that post and see how they did.

We have gone from VERY WEAK to VERY STRONG in the market in one week flat!

Expect some increased volatility ahead as traders try to get a handle on where we go from here.

As always be prepared for ANYTHING!!!

Until next week…Good Trading to YOU!

Swing Trading BLOG – Week in Review – June 10, 2011

Sunday, June 12th, 2011

Swing Trading BLOG – Swing Trading BOOT CAMP

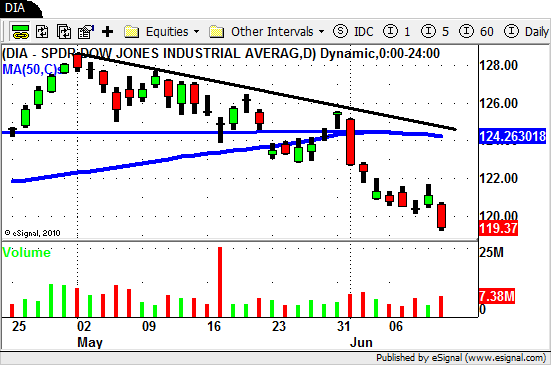
DIA - Swing Trading ETF

And DOWN WE GO!

Inverse ETF's rally and the SHORTS come out in droves.

Traders watched the overall market continue its sell off this week.

After four days of sideways trading the sellers stepped in again on Friday and pushed the market down to new multi month lows.

Almost every sector on the map felt the pain.

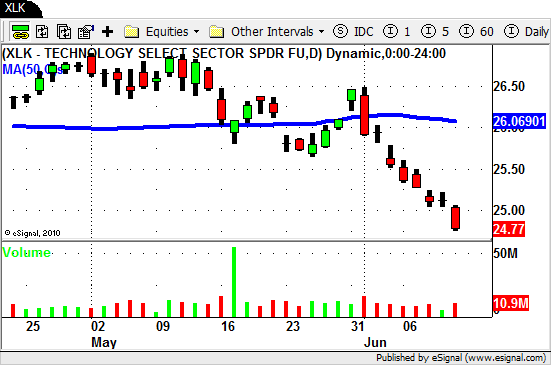
Technology related ETF's continued to fall.

XLK - Swing Trading ETF

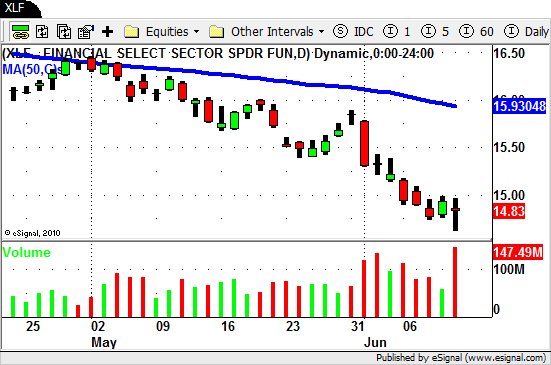
Real Estate and Financial ETF's got pummeled.

XLF - Swing Trading ETF

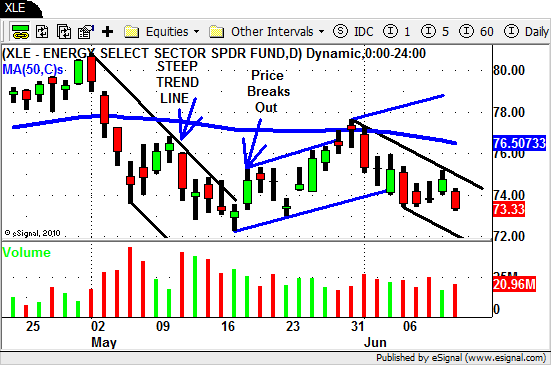
The Energy and Oil ETF's that were showing signs of strength last week are now not looking so strong.

If these sectors break down through the near term support levels they definitely have room to fall.

XLE - Swing Trading ETF

The market looks ripe to continue to move lower as the strongest stocks look to be "rolling over".

If you are looking to the SHORT side for trades try to find stocks or ETF's that are not yet extended to the downside.

If you are not comfortable with SELLING SHORT then you can always look to "get long" some Inverse ETF's.

As always be prepared for anything and act accordingly.

Until next week…Good Trading to YOU!
Swing Trading Technical Analysis – $MOS – Part 2

Wednesday, May 18th, 2011

Swing Trading Technical Analysis – Swing Trading BOOT CAMP

In this BLOG post we will continue our Technical Analysis view on $MOS.

If your missed part one you can view it HERE.

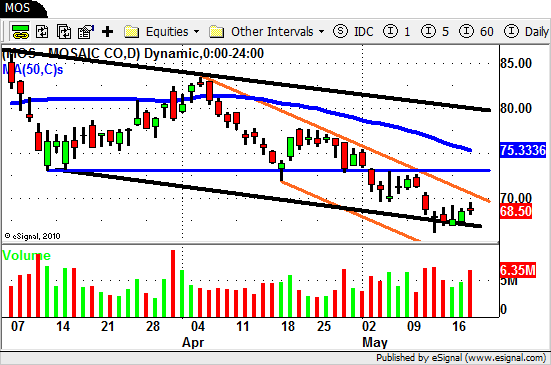
$MOS - Swing Trading Technical Analysis

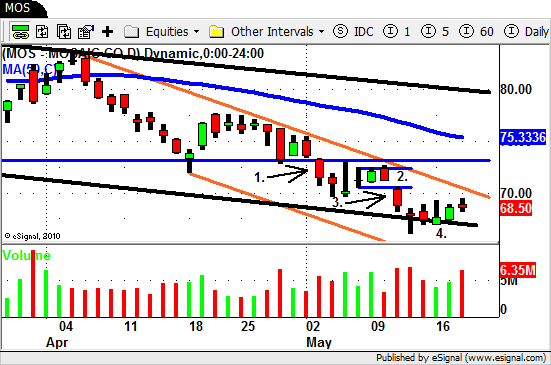
We when last looked at $MOS it had just created another LOWER HIGH and was "stalling" near an area of potential support ($73).

The thick BLUE horizontal line in the chart above marks this support area.

We also posted that in order for the DOWN TREND to continue we would need to see PRICE move LOWER and VOLUME move HIGHER.

We have zoomed in a bit on the chart and annotated our comments as well.

$MOS - Technical Analysis

Two days after we posted our analysis $MOS did push LOWER ON HIGHER VOLUME confirming that the DOWN TREND was still intact.

We marked this as #1 on the chart.

$MOS quickly lost steam and two days later put in a HIGH VOLUME day but closed very near the low fo the day.

The SELLERS were still there!

$MOS continued to trade "sideways"  (#2.) until May 11th when PRICE again moved LOWER and VOLUME INCREASED (#3.)

This created another leg down in the already established DOWN CHANNEL (orange).

After another day of trading a bit lower $MOS again traded "sideways"  (#4.) until today when we watched $MOS trade above yesterdays high on increased volume.

Now even though $MOS has technically started a retrace it is still in an obvious DOWN TREND.

Notice above how $MOS is still trading inside it SHORTER TERM TREND CHANNEL (thick ORANGE LINES) as well as its LONGER TERM DOWN CHANNEL (thick BLACK LINES).

How and where you could have entered and exited a trade in $MOS depends of course on your time frame and style of trading.

As we move forward from here we apply the same logic and let price action and volume tells where $MOS is headed.

A BREAKOUT of the SHORT TERM TREND CHANNEL would NOT excite us to much at this point since there are now a bunch of resistance levels to contend with.

The LONGER TERM chart of $MOS tells us that $65 has acted a a pretty major area of support in the past.

That being said another move LOWER on HIGHER VOLUME is something we are definitely on the look out for.

If this Swing Trading Technical Analysis walk through was helpful to you please leave a comment below.

Swing Trading BLOG – Week in Review – May 6, 2011

Saturday, May 7th, 2011

Swing Trading BLOG – Swing Trading BOOT CAMP

The overall market SOLD OFF this week as sellers stepped and drove stocks lower.

The SELL OFF came in INCREASED VOLUME after the market pushed higher last week on less than stellar volume.

The SELL OFF has traders looking to INVERSE ETF's for possible trade setups in the very near future.

The Energy and Oil ETF's took a hit and and going to be sectors to watch moving into next week.

Agriculture ETF's continue to show weakness and the Steel sector could be headed towards a NEW LOW.

You can see a Technical Analysis walk through on one of the weak Agriculture stocks ($MOS) by clicking HERE.

The Retail and Semiconductor ETF's and holding up very well during this recent PULL BACK in the market.

Despite the recent selling pressure just remember that the market is still trading above its 50 day SMA.

The are more Swing Trading opportunities on BOTH sides of the market now so that tells us that we are at a pivotal point.

There are still plenty of strong stocks to watch ($R, $INFA, $K, $WLK, $ERTS, $M) so make sure to have a plan for next week.

If we trade higher on good volume next week the market could continue its move up.

If we trade higher and volume doesn't follow through then we could be in for another leg down in the near term.

Until next week…Good trading to YOU!

© Swing Trading Boot Camp 2024