Archive for the ‘Swing Trading’ Category

Swing Trading Technical Analysis – $MOS – Part 2

Wednesday, May 18th, 2011

Swing Trading Technical Analysis – Swing Trading BOOT CAMP

In this BLOG post we will continue our Technical Analysis view on $MOS.

If your missed part one you can view it HERE.
$MOS - Swing Trading Technical Analysis

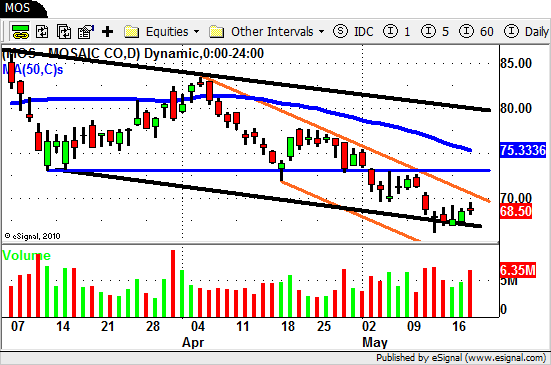
We when last looked at $MOS it had just created another LOWER HIGH and was "stalling" near an area of potential support ($73).

The thick BLUE horizontal line in the chart above marks this support area.

We also posted that in order for the DOWN TREND to continue we would need to see PRICE move LOWER and VOLUME move HIGHER.

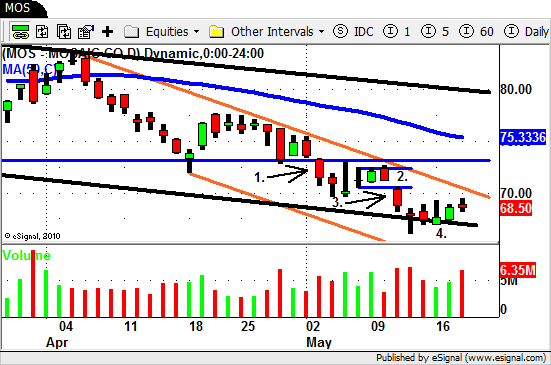
We have zoomed in a bit on the chart and annotated our comments as well.
$MOS - Technical Analysis

Two days after we posted our analysis $MOS did push LOWER ON HIGHER VOLUME confirming that the DOWN TREND was still intact.

We marked this as #1 on the chart.

$MOS quickly lost steam and two days later put in a HIGH VOLUME day but closed very near the low fo the day.

The SELLERS were still there!

$MOS continued to trade "sideways"  (#2.) until May 11th when PRICE again moved LOWER and VOLUME INCREASED (#3.)

This created another leg down in the already established DOWN CHANNEL (orange).

After another day of trading a bit lower $MOS again traded "sideways"  (#4.) until today when we watched $MOS trade above yesterdays high on increased volume.

Now even though $MOS has technically started a retrace it is still in an obvious DOWN TREND.

Notice above how $MOS is still trading inside it SHORTER TERM TREND CHANNEL (thick ORANGE LINES) as well as its LONGER TERM DOWN CHANNEL (thick BLACK LINES).

How and where you could have entered and exited a trade in $MOS depends of course on your time frame and style of trading.

As we move forward from here we apply the same logic and let price action and volume tells where $MOS is headed.

A BREAKOUT of the SHORT TERM TREND CHANNEL would NOT excite us to much at this point since there are now a bunch of resistance levels to contend with.

The LONGER TERM chart of $MOS tells us that $65 has acted a a pretty major area of support in the past.

That being said another move LOWER on HIGHER VOLUME is something we are definitely on the look out for.

If this Swing Trading Technical Analysis walk through was helpful to you please leave a comment below.

Swing Trading BLOG – Week in Review – May 13, 2011

Sunday, May 15th, 2011

Swing Trading BLOG – Swing Trading BOOT CAMP

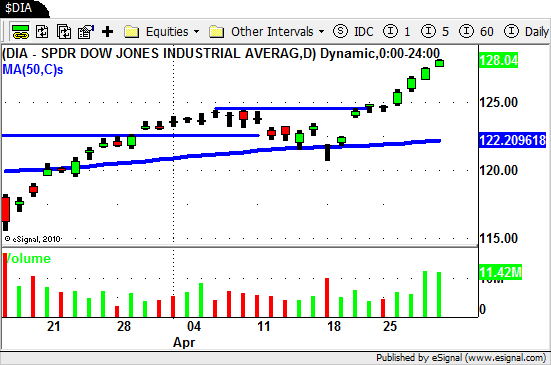
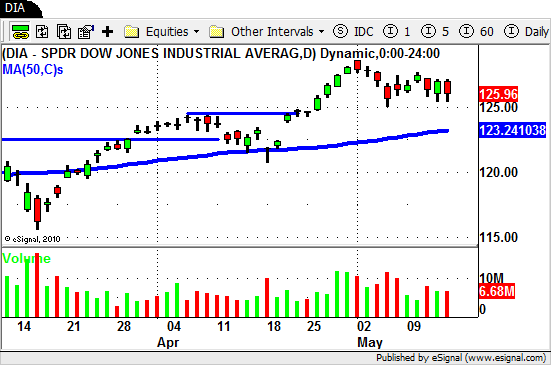
$DIA

After last weeks SELL OFF the market put in a LOW VOLUME bounce to start the week.

Wednesday SELLERS stepped back into the market and pushed the market a bit lower.

The sideways trading that followed to end the week lets us know that a struggle is underway.

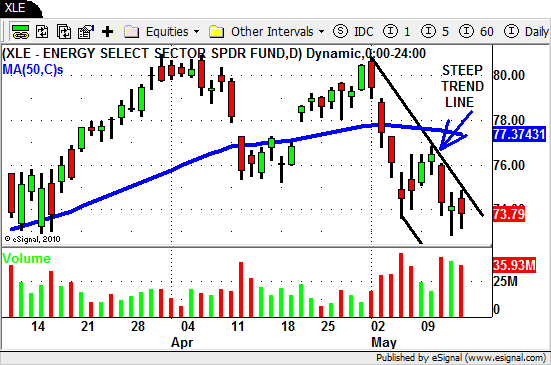
Oil and Energy ETF's continued their move down but the angle of the SHORT TERM DOWNTREND line is a bit steep.

$XLE

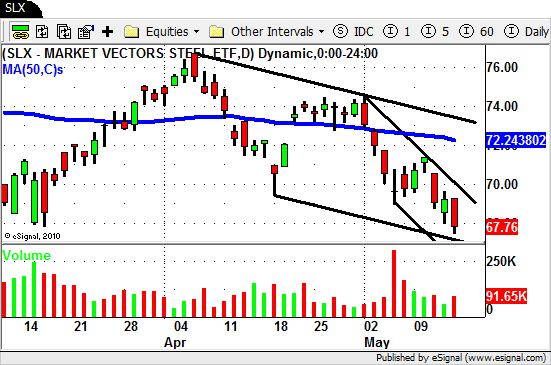
The Steel sector ETF ($SLX) continued to show it's relative weakness and pushed to a NEW LOW for the year this week.

It's no surprise that stocks like $X, $AKS and $STLD offered nice SHORT trade setups this week.

$SLX - Swing Trading ETF's

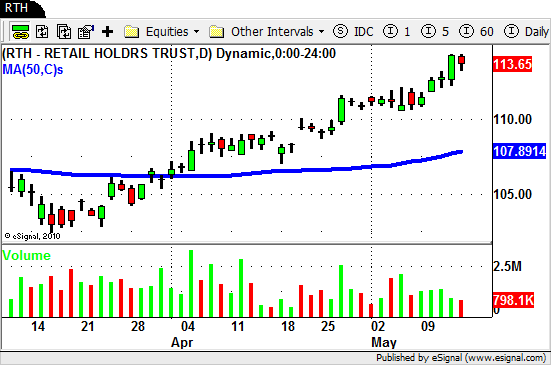
On the flip side this week was the Retail ETF ($RTH) which broker out to NEW HIGHS this week.

The move up was on INCREASING VOLUME but ended the week "stalling" at the high as volume dropped.

$RTH - Swing Trading ETF's

Next week should be interesting for sure.

The major market indices put in a LOWER HIGH so lets see if a LOWER LOW is in order.

If the previous SWING LOW holds and VOLUME comes back into the market on the BUY side then look for confirmation on a break of the previous SWING HIGH.

Until next week…Good Trading to YOU!

Swing Trading BLOG – Week in Review – May 6, 2011

Saturday, May 7th, 2011

Swing Trading BLOG – Swing Trading BOOT CAMP

The overall market SOLD OFF this week as sellers stepped and drove stocks lower.

The SELL OFF came in INCREASED VOLUME after the market pushed higher last week on less than stellar volume.

The SELL OFF has traders looking to INVERSE ETF's for possible trade setups in the very near future.

The Energy and Oil ETF's took a hit and and going to be sectors to watch moving into next week.

Agriculture ETF's continue to show weakness and the Steel sector could be headed towards a NEW LOW.

You can see a Technical Analysis walk through on one of the weak Agriculture stocks ($MOS) by clicking HERE.

The Retail and Semiconductor ETF's and holding up very well during this recent PULL BACK in the market.

Despite the recent selling pressure just remember that the market is still trading above its 50 day SMA.

The are more Swing Trading opportunities on BOTH sides of the market now so that tells us that we are at a pivotal point.

There are still plenty of strong stocks to watch ($R, $INFA, $K, $WLK, $ERTS, $M) so make sure to have a plan for next week.

If we trade higher on good volume next week the market could continue its move up.

If we trade higher and volume doesn't follow through then we could be in for another leg down in the near term.

Until next week…Good trading to YOU!

Swing Trading BLOG – Week in Review – April 29, 2011

Saturday, April 30th, 2011

Swing Trading BLOG – Swing Trading BOOT CAMP

$DIA

UP, UP and Away!

The markets continued to rally this week as the DJIA and the S&P 500 traded to NEW HIGHS!

This was a great week for Swing Traders.

Not simply because the markets went higher but more importantly it was the WAY that they moved higher.

There were some great chart patterns to trade this week and most of them played out in text book form.

The price action and volume swing trading techniques that we use (and teach) painted a crystal clear picture this week.

Want to see what we mean?

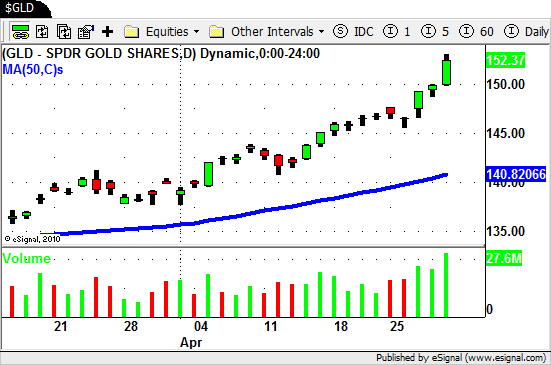
We have been focused on the Gold and Silver ETF's lately and $GLD had a great chart pattern to trade this week.

Here is a look at the chart…

$GLD

Learning how to read price action AND volume together is a powerful skill set to add to your trading.

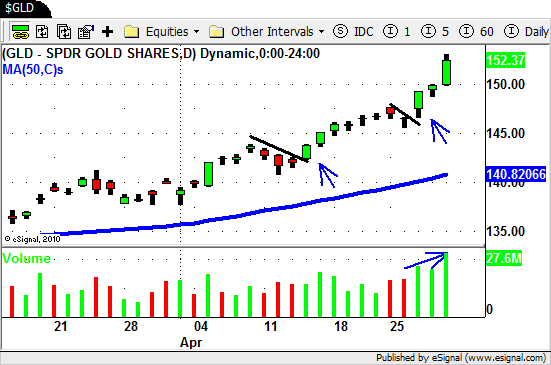
The BLACK lines on the chart below are "pullbacks" in the obviously strong, trending Gold ETF.

$GLD

This weeks "pullback" actually consisted of two days…a high volume reversal day on Monday and day that traded lower on Tuesday.

Wednesday offered another opportunity for Swing Traders to enter into this rally.

The GAP UP was the first clue that the next move higher was upon us.

The opening price ($147.38) on the GAP UP was just below the previous Swing High set on Monday ($147.58).

By NOON time $GLD was rallying through that previous Swing High and the VOLUME was flowing into this ETF.

$GLD continued to rally the rest of the week and the VOLUME that accompanied the move was exactly what we like to see in a strong move.

There were several great examples of strong stocks with great chart patterns to trade this week.

Stay tuned to the BLOG and we will post some of the other trades we made.

Until next time….Good Trading yo YOU!

© Swing Trading Boot Camp 2025