Archive for the ‘Swing Trading’ Category

Swing Trading Week in Review – June 18, 2010

Friday, June 18th, 2010

As the market continued its recent up move our "short term" LONG swing trades turned out nicely.

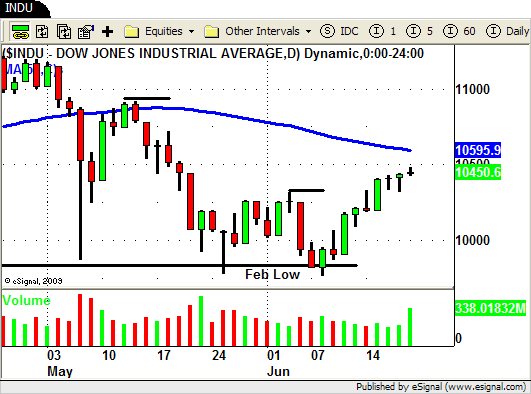
After bouncing off of the February lows the market has moved up for the last 9 days straight.

DJIA  Daily Chart

As you know from our last few BLOG posts we entered into some LONG swing trades (in strong stocks) as the market confirmed its "bounce" off of the February lows.

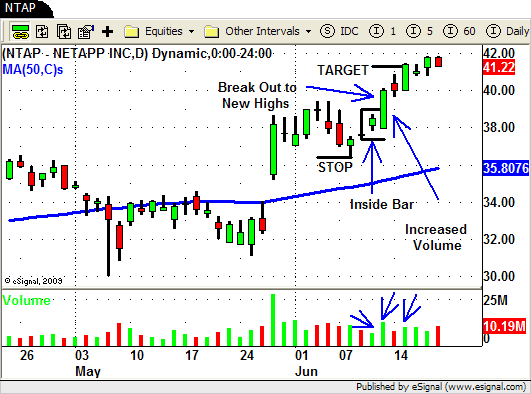
Strong stocks like ALK, AKAM and NTAP (chart below) hit their profit targets this week.

NTAP - Swing Trade

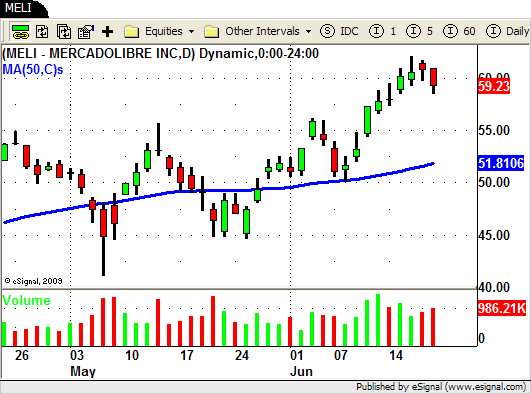
One of the strong stocks the we did not take a trade in but also turned out nicely was MELI.

MELI - Swing Trade

MELI made a nice run to new yearly highs as the market made its "bounce".

In tonight's webinar we discussed how we determined which stocks and ETF's to trade during this last move in the market.

One of the biggest "clues" we look for is when a stock or ETF shows strength or weakness in relation to what the overall market is doing.

Look at the stocks we listed above.

All of the stocks above were showing signs of strength as the market was trading down to the February lows.

As the market confirmed its "double bottom" price pattern these strong stocks and ETF's were putting in a higher low prior to taking off to new highs.

The strongest stocks were also trading above their 50 period SMA, a basic filter we use to determine strength or weakness, while the market was trading well below it.

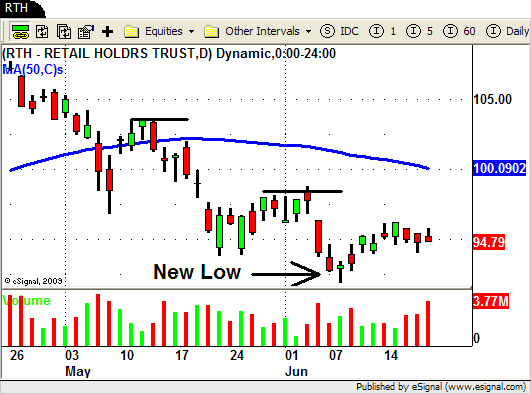
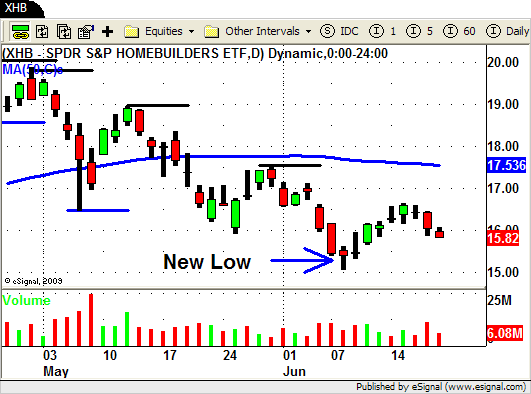
In contrast the weaker ETF's (and individual stocks) were the ones that made new lows or lower lows as the market "double bottomed".

Take a look at the chart of the DOW (above) and compare it to the RTH and XHB (below).

RTH - Swing Trade

XHB - ETF Swing Trade

You can see how both sectors made new lows as the market put in the "double bottom" on June 8th.

We steered clear of these sectors during the recent up move and will continue to do so until they show signs of becoming at least as strong (and preferably stronger) than the overall market.

By locating the "clues" that these stocks and ETF's were giving us we were able to make some profitable LONG trades in a then down trending environment.

If you have any questions about the trades we entered into this week please post them below…we would love to hear from you!

Until next week…Good Trading to YOU!


Swing Trading Week in Review – June 11, 2010

Friday, June 11th, 2010

Well after a mild continuation sell off that started last week the markets finally put in a decent move to the upside to finish positive for the week.

Monday we watched the market continue lower but we noticed the this move was not accompanied by strong volume.

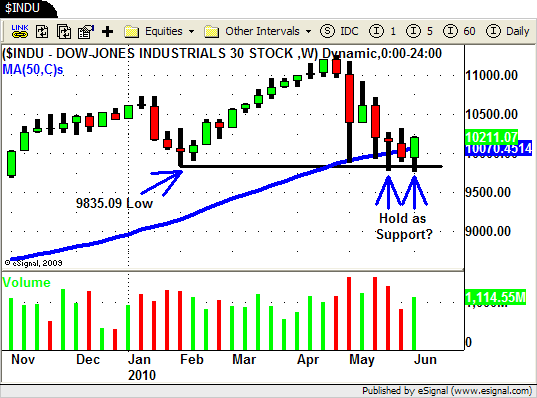
We were focused on the 9835.09 level in the Dow as a possible level of support.

9835.09 is the low of the reversal day that happened on February 5th and was essentially the starting point for the 1400 point that followed.

The chart below is the WEEKLY chart of the DJIA to show you the level we were looking at.

Dow Jones Weekly Swing Chart

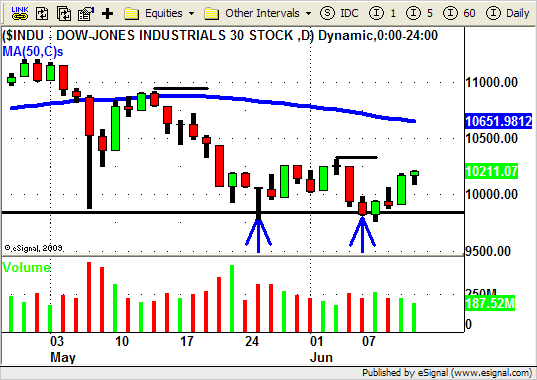
And here is the daily chart of the DJIA which shows you an additional "touch" of this area back on the 25th of May.

DJIA Daily Swing Trading Chart

Watching the price and volume action around this level would give us a "clue" to what the market may do next.

Tuesday the market did head lower to break through the 9835.09 level once again but by the end of the trading session you could almost feel the tide turning.

We were able to cover most of our SHORT positions (DOW, KLAC, UPS) into this down move on Tuesday as price reached our initial profit targets.

We tightened up our stops and were stopped out of the remainder of our positions on Wednesday morning as the market rallied to new highs around 11am.

Tuesday and Wednesday's price action told us that a "bounce" or "retrace" had begun (at least for the short term) so it looked like the 9835.09 would once again hold as support.

Anticipating the possibility of a "bounce" we also had several stocks on our watch list that were showing signs of relative strength during the recent down move.

Our strategy was to buy a few of these strong stocks if price firmed up around the 9835.09 level and began to show signs of moving up.

As the morning progressed Wednesday we did enter into a few new LONG swing trades.

One of the "strong" stocks we have been watching is NTAP.

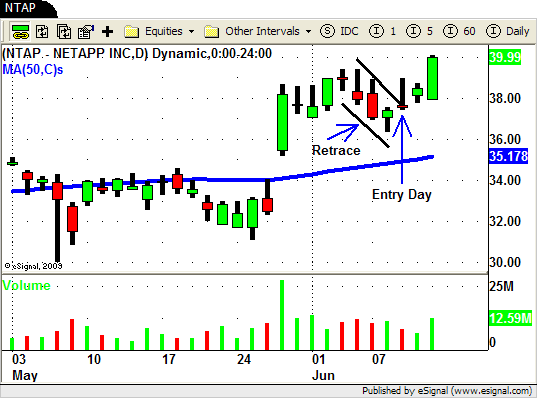
After a nice run up to NEW HIGHS you can see how NTAP put in a pretty text book retrace from the HIGH of last Thursday to the LOW of Tuesday's trading.

NTAP - Long Swing Trade Example

This pullback from NEW HIGHS was happening as the market was headed lower from a LOWER HIGH into a possible support area…a good sign of strength.

Tuesday's price action in NTAP gave us the "heads up" for it's next possible leg up.

Wednesday, when the market gapped up, we payed close attention to NTAP and once we saw the relative strength in the overall market and NTAP we were able to enter into a LONG position at just over $38.

The market rolled over hard into the close Wednesday and NTAP actually closed well below our entry price after being UP almost $1 in this position.

This is more often than not a sign that our trade will not work out but instead of jumping the gun we just followed of rules like every other trade we put on.

Our STOP for this trade was set at 1 ATR or $1.70 in this case.

The late day reversal on Wednesday brought NTAP within .09 of stopping us out of this trade as the market closed.

From a HIGH of nearly $39 NTAP traded all the way down to a LOW of $37.39 by the close.

Since $39 minus $1.70 is $37.30 (our trailing ATR stop level) that shows you just how close we were to being stopped out.

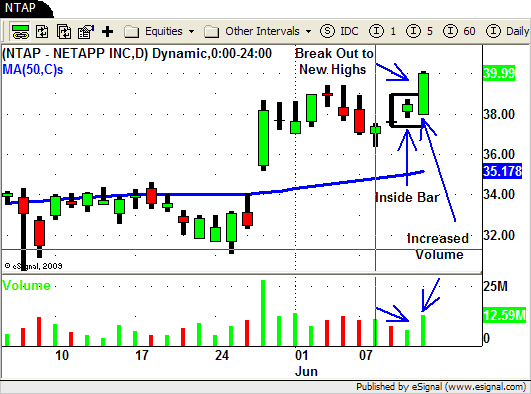
Thursday the market gapped up a bit a NTAP had an "inside day" on LOWER VOLUME.

No sign for panic but not a great sign for us as the market moved higher.

NTAP - Swing Trading Example

Friday we got the follow through in NTAP that we were looking for…a nice move UP on INCREASED VOLUME.

As NTAP closed today at just under $40 we trailed our stop up accordingly and, absent any HUGE gap down, have locked in at least a small profit on this trade.

Follow your trading plan and don't try to outguess the market!

Until next week…GOOD TRADING TO YOU!


Swing Trading Week in Review – June 4, 2010

Friday, June 4th, 2010

And here we go again!

The Dow and S&P finished down 2% for the week while the Nasdaq held up a little better by losing ONLY 1.7%.
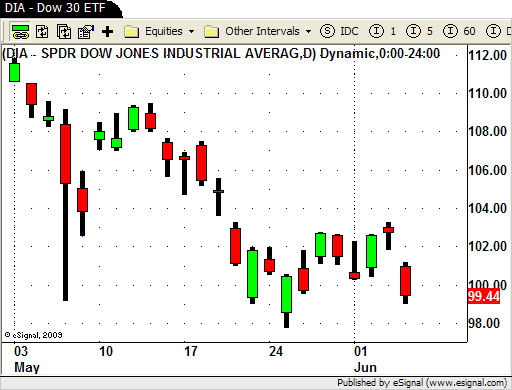
DIA Swing Trading ETF

Sounds pretty plain and simple but the trading during the week was a little bumpy.

The holiday week started off with yet another GAP DOWN in the market.

We know that the buyers have been defending the area just above 10,000 in the Dow as this GAP DOWN brought us right into this area.

The market rallied right from the open but late day selling came into the market and pushed the market down to close below its open…a true reversal day.

Wednesday the buyers stepped back into the market at near the same levels (just above 10,000) pushing the market higher right into the close.

Thursday the market GAPPED UP a bit but quickly fizzled out and closed near its mid point of the day.

Then Friday comes and BAM!…down we go again.

Sellers aggressively took the market lower with the Dow finishing down over 300 points for the day!

This was an important week in our opinion.

Not because of any significant financial related news or event.

We think it was important because of the lesson you could learn from this weeks trading action.

If you are a short term trader then the valuable lesson to be learned from this week's price action is to have "re-entry" plan in place.

Let's rewind a bit and look at the charts to see what we mean,

After last Friday's lackluster performance it appeared that Tuesday was setting up for the next leg lower in this down trend.
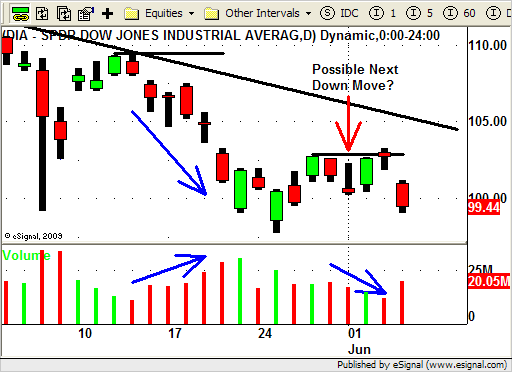
DIA - Dow 30 ETF

As a matter of fact there were a TON of SHORT Swing Trading setups on our "watch list".

We notified our newsletter subscribers of several SHORT stock setups and several possible LONG Inverse ETF setups for Tuesday morning.

The market GAPPED DOWN on Tuesday and the late day sell off actually triggered several of our SHORT swing trades near the close.

We did notice however that by the close the volume levels for this "reversal day" were low…not exactly what you want to see when the market reverses.

Trading price action is our primary focus but this volume "clue" was a caution flag for us.

On Wednesday the market rallied right from the open and closed near its high for the day…another bad sign for our SHORT positions.

Our best trades usually work right from the start and with the market moving up so strongly we were now "taking some pain" in our positions.

Another thing we noticed is that in some of our positions the volume INCREASED as price rallied on Wednesday.

We know from understanding the PVT Method that price moving UP as volume INCREASES is classic UP trending price action.

Look at the chart of KLAC below.

You can see where we entered out SHORT position (RED ARROW) and then look at Wednesday and Thursday's price and volume action.
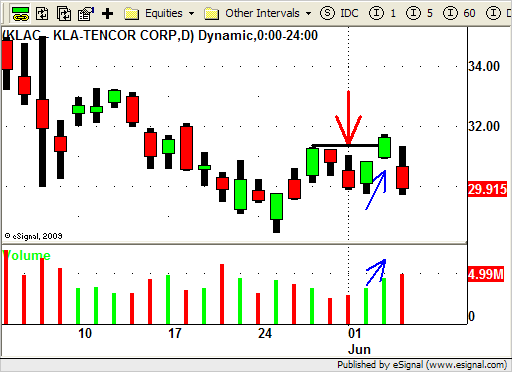
KLAC - Swing Trading Stop Out

KLAC trades higher on INCREASING VOLUME (blue arrows) and closes above the recent swing high and our STOP LOSS point (black line).

Friday KLAC heads lower on INCREASING VOLUME confirming the "two stage" retrace.

Some of our other SHORT positions went up a bit with the market on Wednesday but on LOWER VOLUME (a clue of things to come?).

Let's look at one of our "good" SHORT positions.

Notice on the chart of DOW Chemical (DOW) below how unlike KLAC price actually moves sideways both Wednesday and Thursday.
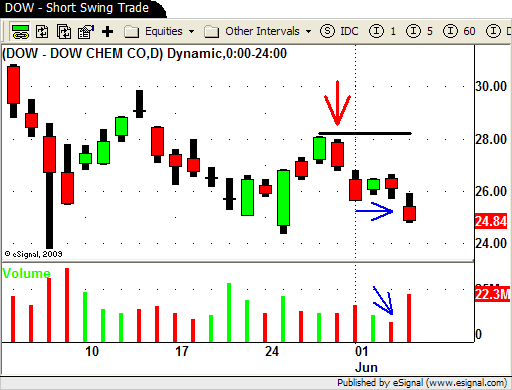
DOW - SHORT swing Trade

This sideways price action is accompanied by LOWER, DECREASING VOLUME a good sign for our SHORT position.

DOW follows through to the down side nicely on INCREASING VOLUME as the market sells off on Friday.

As you can see from the charts above things played out pretty much as anticipated.

We got stopped out of some of our SHORTS that continued to rally on increased volume on Thursday.

Can you guess by now which positions stopped us out?

Our other positions that went up a bit with the market on LOWER volume (like Dow Chemical) ended up closing under their recent swing highs so we were able to hold onto to these.

We thought that Thursday's move in some of these stocks was possibly a "two stage" retrace so we were ready by Friday to re-enter our SHORT positions if price action called for it.

Friday the market GAPPED DOWN again and after about an hour of sideways trading rolled over and finished the day DOWN over 300 points on INCREASING VOLUME!

Our "good" short positions followed through nicely and, as planned, we re-entered into some of our positions that stopped us out just the day before.

By using both price action and volume we avoided getting "shaken out" of some of our SHORT positions.

Getting STOPPED OUT for a loss or near break even is not fun but by following our "re-entry" rules we were able to get back on the right side of the market and hopefully profit from our analysis.

Until next week….GOOD TRADING TO YOU!
Swing Trading Week in Review – May 28, 2010

Friday, May 28th, 2010

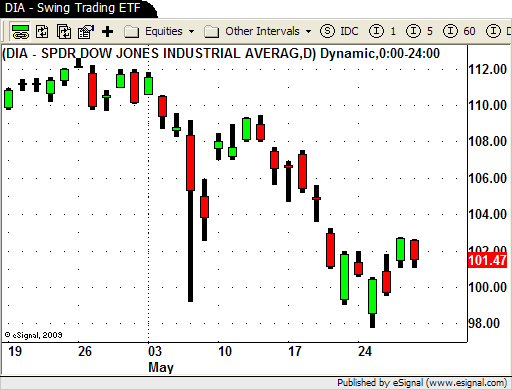
Gap DOWN and roll over, Gap DOWN and RIP, Gap UP and roll over!

After all is said and done the roller coaster came to a stop and finished down about 60 points for the week.

Not bad considering that we gapped down HUGE on Tuesday and traded down to new yearly lows intraday.

DIA - Swing Trading ETF

All in all the week was a rather boring one for our Basic Swing Trading strategies.

If you were not already short coming into the week it was a little late and difficult to initiate any new SHORT positions.

Most of our basic bread and butter strategies are "with trend" strategies which means that we focus on swing trade setups in the same direction as the overall market and sector.

If the market is in a DOWN trend or DOWN channel these strategies focus on SHORT Swing Trading setups (or LONG Inverse ETF's).

If the market is in an UP trend or UP channel then of course we look for LONG Swing trades.

Some of our more advanced Swing Trading strategies are actually designed as "counter trend" strategies.

These strategies are designed to trade and profit from "bounces", pullbacks and retraces and trade in the opposite direction of the dominant trend.

An example of this would be buying into a LONG position in a DOWN trending stock as it comes into a possible area of support.

The are of course other factors to consider when using "counter trend" strategies and these should strategies should only be used by experienced swing traders.

I mention these advanced strategies because this week we saw a good opportunity to use them.

On Tuesday we noticed that the HUGE gap down brought us down to levels in the S&P and Dow that we saw in the beginning of February.

After such as extended move DOWN over the past 2 weeks you had to think that there MAY be some support in the area.

We did NOT blindly buy into the GAP down but instead we waited to see how the market traded around this level.

By mid morning on Tuesday the strength in the market was obvious…there were buyers picking up stock at these new lows.

As the market started to follow through the rest of the day we were able to initiate a few LONG trades.

We looked for relatively strong stocks that were either OVERSOLD or showing signs of holding a support level.

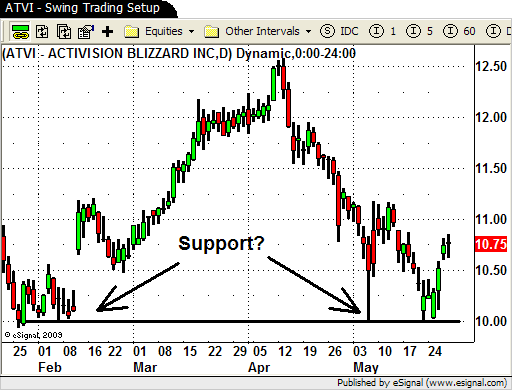
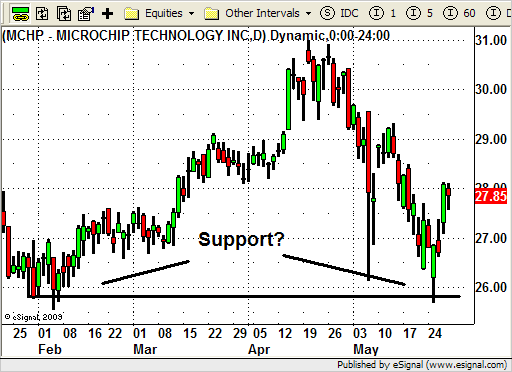
Stocks like ATVI and MCHP.

ATVI - Swing Trading Setup

MCHP - Swing Trading Setup

Both ATVI and MRVL were SHORT TERM OVERSOLD as they traded into their LONGER term support levels.

Tuesday's GAP and RIP gave us any opportunity for a low risk trade in both stocks.

We exited ATVI today (Friday) for a nice gain as it reached SHORT TERM OVER BOUGHT levels into the close.

MRVL was not yet OVER BOUGHT as of the close so we exited a portion of position and are trailing the rest with a tight stop.

We did stay away from some of the other stocks with similar patterns due to their recent weakness.

AXP and X come to mind as well as some of the other financial stocks.

We put these stocks on our "DO NOT TRADE" list because both sectors have been the leaders to the DOWN side in recent weeks.

The recent "bounce" in the market could simply be a pullback before the next down move.

If so we have a bunch of stocks that are setting up nicely to the SHORT side.

If the market finds some legs and continues UP from here we have a few positions on and we will trail our stops accordingly.

We will also look for opportunities to get into some of the strong stocks like FDO, SNDK, ALK and WSM.

No one knows for sure which way we go from here but by being able to trade the market by using some advanced strategies you should be able to make profitable trades in any environment.

Until next week…GOOD TRADING TO YOU!

© Swing Trading Boot Camp 2025