Archive for the ‘Swing Trading Stocks’ Category

Swing Trading Week in Review – January 13, 2012

Friday, January 13th, 2012

Swing Trading Blog – Swing Trading Boot Camp
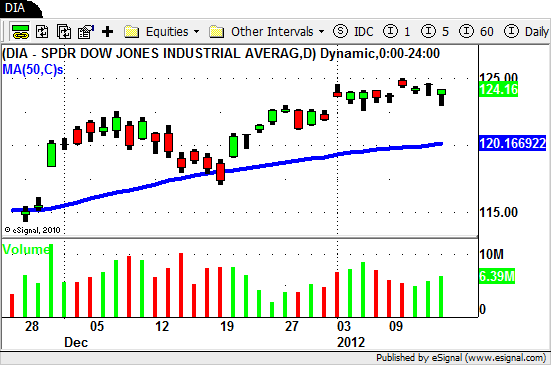
DIA - Swing Trading ETF

The sideways trading continues!

Swing Traders were a little excited Tuesday as the market GAPPED UP and broke out of the week long sideways trading range.

As the day progressed though the price action and volume painted a different picture. The low volume and close near the lows of the day did give us much conviction.

The rest of the week looked a lot like last week. Sideways trading and lack of follow through in the overall market.

Some individual stocks on the other hand looked much more impressive.

After breaking out of a longer term down channel $WLK broke out to a higher high on Monday.

Look at the last 5 days of volume. A pretty picture indeed!
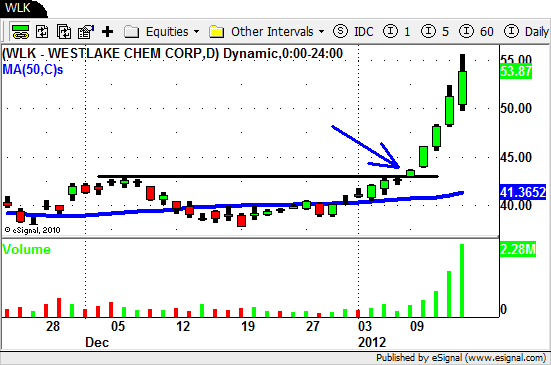
$WLK - Swing Trading

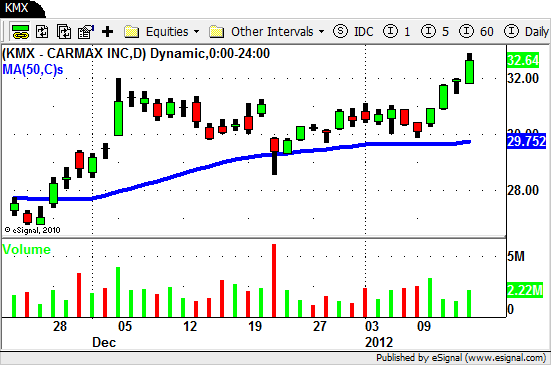
$KMX made a nice move to the upside after a nice price and volume move on Tuesday.

The move takes $KMX to new multi month highs.
$KMX - Swing Trading

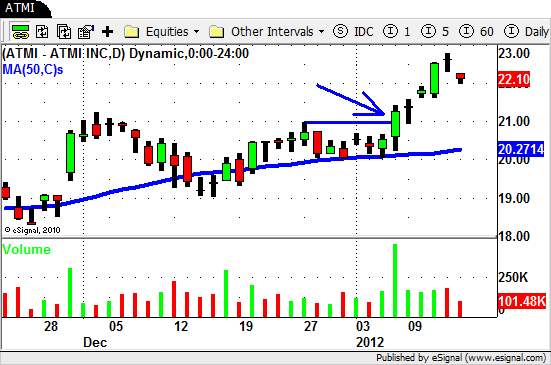
$ATMI (mentioned is last weeks BLOG POST) continued its UP move after breaking out of a nice "cup and handle" pattern on the daily chart.
ATMI - Swing Trading

The market remains strong and continues to hover near its high.

While its hard to look to the SHORT side with such apparent overall strength stay aware of the sectors that aren't really acting that well.

This will paint and very detailed picture for you of where the market sits and how each sector is acting.

Know each and every day which sectors and stocks are showing relative strength and which are showing weakness.

Doing so will keep your on the right side of the market and will also give you an idea of where to turn if the market reverses.

As always be prepared for anything and act accordingly when the market tell you to.

Until next week…good trading to YOU!


Swing Trading BLOG – Week in Review – July 22, 2011

Sunday, July 24th, 2011

Swing Trading BLOG – Swing Trading BOOT CAMP

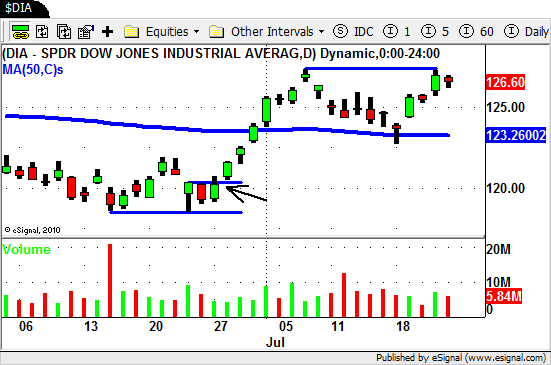
$DIA - Swing Trading ETF

Nice follow through this week!

After a spike down below the 50 day SMA on Monday the market found its footing and resumed its move to the UP side this week.

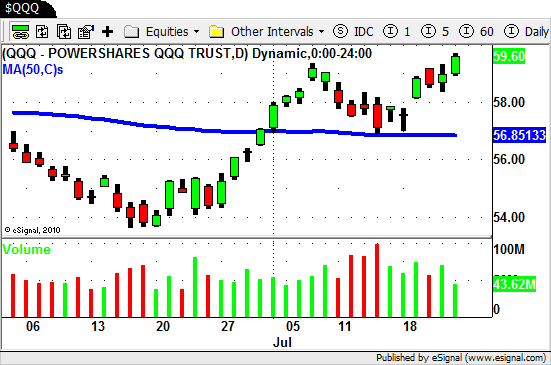
As far as the indices are concerned the NASDAQ actually rallied up to a HIGHER HIGH while the DOW and S&P lagged behind a bit.

$QQQ - Swing Trading

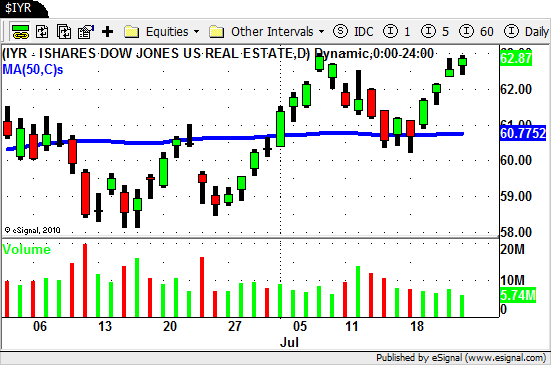
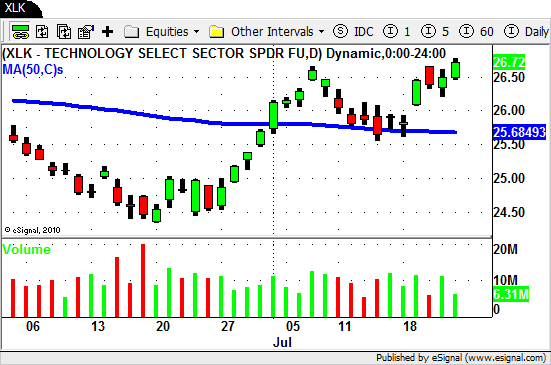
As expected the overall market did well but a few sectors really stood out.

Here is a look at the charts for a few of the sector ETF's that performed well.

$XLE

$XLE - Swing Trading ETF

$IYR

$IYR - Swing Trading ETF

$XLK

$XLK - Technology ETF

$OIH

$OIH - Oil Services ETF

In last weeks BLOG POST we mentioned several individual stocks in these sectors to watch.

The Energy and Oil Service stocks we mentioned all did well.

The Casino stocks moved up but lacked the "pop" (so far) that we were looking for.

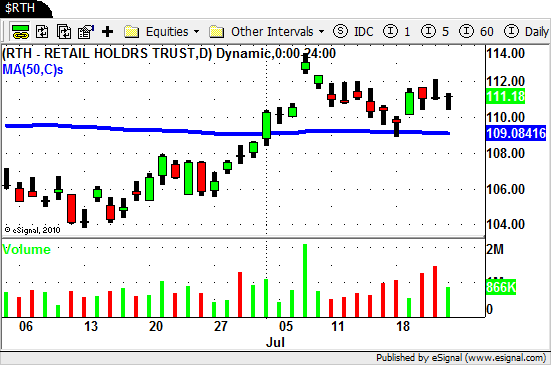
The Retail stocks (and ETF) basically "stalled" after moving higher on Tuesday.

$RTH - Retail ETF

The Gold, Gold Miners and Silver ETF's continue to hold up after putting in a nice rally recently.

Keep your eye on the Agriculture ETF's (and stocks) as we move forward since we are seeing some interesting price action and volume patterns lately.

$MOO has drifted up but $DBA is still lagging behind.

The market has moved up fast this week and is flirting with being short term overbought.

Remember though that an overbought (or oversold) market can become even MORE OVERBOUGHT.

Price action and volume paint a picture so look for the clues the market gives you.

Be prepared for anything and as always…Good Trading to YOU!

Swing Trading BLOG – Week in Review – May 6, 2011

Saturday, May 7th, 2011

Swing Trading BLOG – Swing Trading BOOT CAMP

The overall market SOLD OFF this week as sellers stepped and drove stocks lower.

The SELL OFF came in INCREASED VOLUME after the market pushed higher last week on less than stellar volume.

The SELL OFF has traders looking to INVERSE ETF's for possible trade setups in the very near future.

The Energy and Oil ETF's took a hit and and going to be sectors to watch moving into next week.

Agriculture ETF's continue to show weakness and the Steel sector could be headed towards a NEW LOW.

You can see a Technical Analysis walk through on one of the weak Agriculture stocks ($MOS) by clicking HERE.

The Retail and Semiconductor ETF's and holding up very well during this recent PULL BACK in the market.

Despite the recent selling pressure just remember that the market is still trading above its 50 day SMA.

The are more Swing Trading opportunities on BOTH sides of the market now so that tells us that we are at a pivotal point.

There are still plenty of strong stocks to watch ($R, $INFA, $K, $WLK, $ERTS, $M) so make sure to have a plan for next week.

If we trade higher on good volume next week the market could continue its move up.

If we trade higher and volume doesn't follow through then we could be in for another leg down in the near term.

Until next week…Good trading to YOU!

Swing Trading Technical Analysis – $MOS

Sunday, May 1st, 2011

Swing Trading Technical Analysis

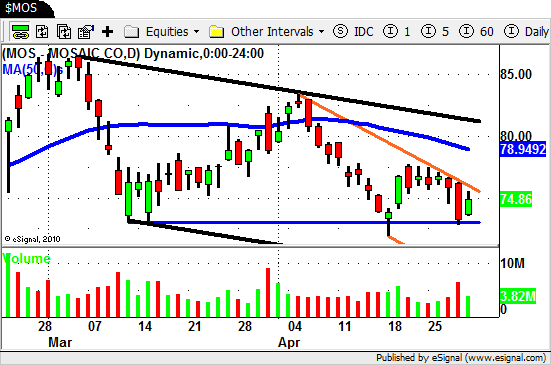
Will the DOWN TREND in $MOS continue or is a BREAK OUT in the near future?

$MOS - Swing Trading Technical Analysis

Let us walk you through our Technical Analysis for this potential swing trade.

The overall trend is obviously DOWN in $MOS.

The THICK BLACK lines indicate the dominant trend channel.

The horizontal BLUE line is a area of potential support since BUYERS have stepped in each time $MOS has traded down to this level.

The ORANGE lines indicate the short term trend channel that $MOS is currently trading in.

The other stocks in this sector are on the move so we are waiting to see what $MOS does in the days to come.

The push lower on INCREASED VOLUME we saw on Thursday was followed by an "inside day" on lower volume.

We consider this a "stall" and will wait to see how $MOS trades out of this chart pattern.

For the DOWN TREND to continue we would need to see PRICE move lower and VOLUME move higher.

Price would have to break through the previous support area and VOLUME (heavy selling) should accompany that to make it happen.

What would an UP move need to look like for us to take a trade?

A BREAK OUT of the ORANGE CHANNEL on INCREASED VOLUME would be a nice trade set up for us.

This would be an STS trade since there is still some overhead resistance to deal with.

Lets see how $MOS does over the next few days and come back to walk through it together.

** Part 2 is posted HERE**

We hope you find this Swing Trading Technical Analysis walk through helpful!

© Swing Trading Boot Camp 2024