Archive for the ‘Swing Trading Charts’ Category

Swing Trading BLOG – Week in Review – June 10, 2011

Sunday, June 12th, 2011

Swing Trading BLOG – Swing Trading BOOT CAMP
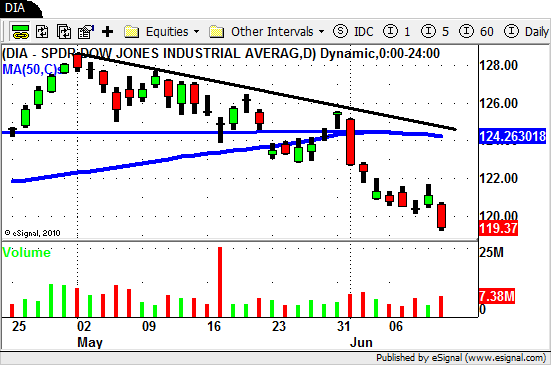
DIA - Swing Trading ETF

And DOWN WE GO!

Inverse ETF's rally and the SHORTS come out in droves.

Traders watched the overall market continue its sell off this week.

After four days of sideways trading the sellers stepped in again on Friday and pushed the market down to new multi month lows.

Almost every sector on the map felt the pain.

Technology related ETF's continued to fall.
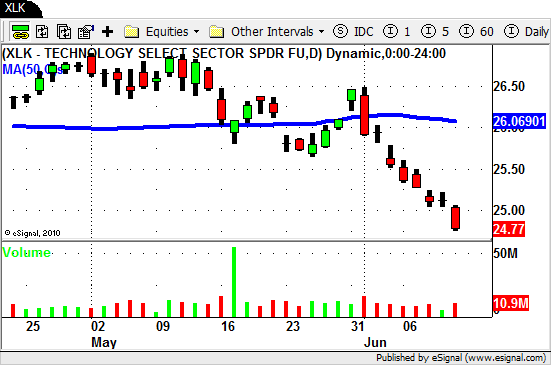
XLK - Swing Trading ETF

Real Estate and Financial ETF's got pummeled.
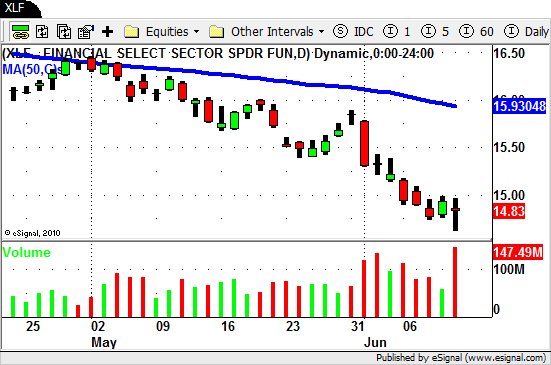
XLF - Swing Trading ETF

The Energy and Oil ETF's that were showing signs of strength last week are now not looking so strong.

If these sectors break down through the near term support levels they definitely have room to fall.
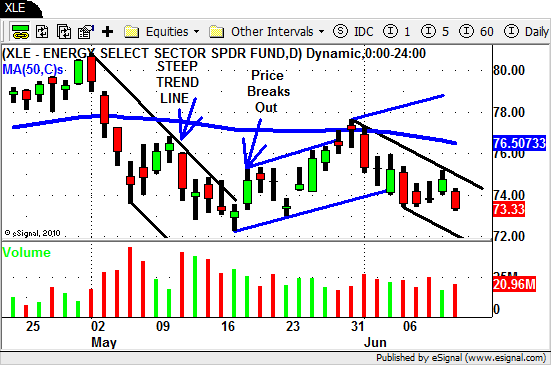
XLE - Swing Trading ETF

The market looks ripe to continue to move lower as the strongest stocks look to be "rolling over".

If you are looking to the SHORT side for trades try to find stocks or ETF's that are not yet extended to the downside.

If you are not comfortable with SELLING SHORT then you can always look to "get long" some Inverse ETF's.

As always be prepared for anything and act accordingly.

Until next week…Good Trading to YOU!

Swing Trading BLOG – Week in Review – May 27, 2011

Monday, May 30th, 2011

Swing Trading BLOG – Swing Trading BOOT CAMP

DIA - Swing Trading ETF

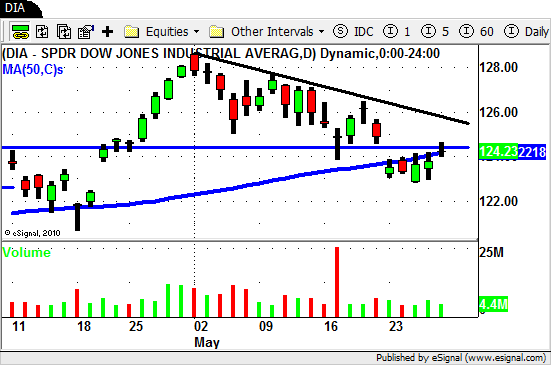
The BIG GAP DOWN we saw on Monday extended the month long correction we have seen in the overall market.

The market is now hoovering near it's 50 day SMA as we saw a bit of a rebound by weeks end.

As we look over our sector ETF LIST it is a mixed bag.

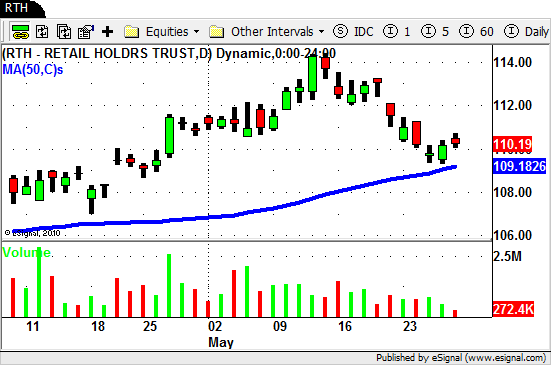
The Retail ETF ($RTH) has pulled back off of it recent high and is still trading above its 50 day SMA.

$RTH - Swing Trading ETF

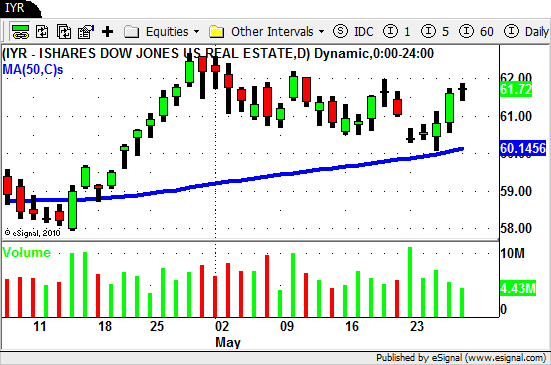
The Real Estate ETF ($IYR) is equally as strong in the short term.

$IYR - Swing Trading ETF

The oversold  Steel, Energy, and Oil ETF's put in a retrace back towards their 50 day SMA's.

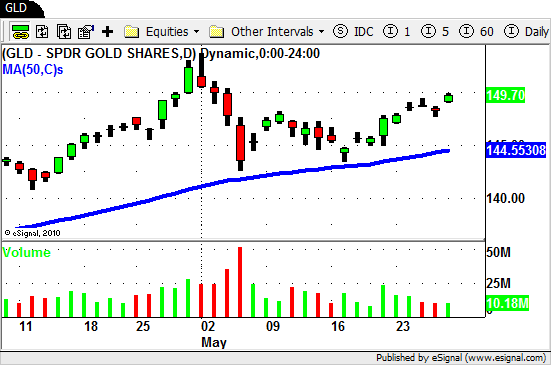
The Gold ETF ($GLD) is starting to shine again so make sure this sector is on your list.

$GLD - Swing Trading ETF

So now that we are back trading near the 50 day SMA where does the market go from here?

Do we continue the short term DOWN TREND?

Do we chop around a bit while the buyers and sellers fight it out?

No one knows for sure but for now we continue to trade both sides on the market.

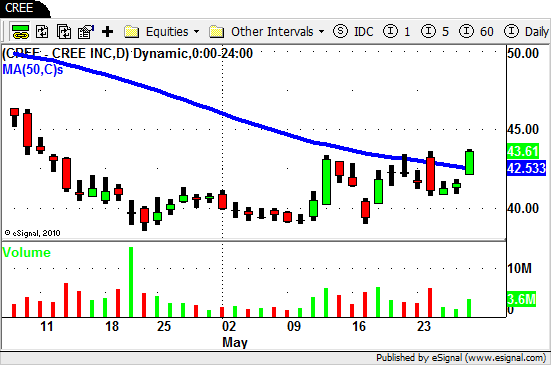
One stock that we are watching to see if it transitions from weak to strong?

Take a look at $CREE…

$CREE - Swing Trading

Keep both strong stocks ($ELN, $CTXS, $INFA, $ANF, etc) and weak ones ($SOHU, $ADSK, $HOG, $DOW) on your list and be prepared for whichever way the market goes from here.

Until next week…Good Trading to YOU!
Swing Trading Technical Analysis – $MOS

Sunday, May 1st, 2011

Swing Trading Technical Analysis

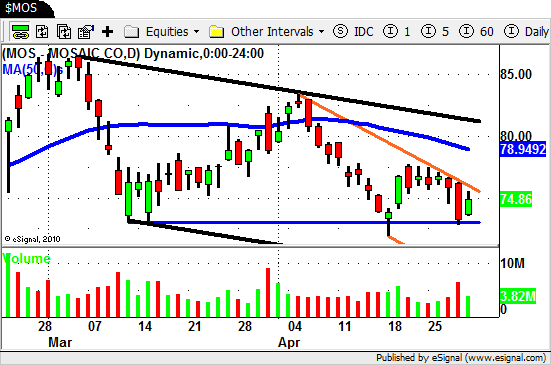
Will the DOWN TREND in $MOS continue or is a BREAK OUT in the near future?

$MOS - Swing Trading Technical Analysis

Let us walk you through our Technical Analysis for this potential swing trade.

The overall trend is obviously DOWN in $MOS.

The THICK BLACK lines indicate the dominant trend channel.

The horizontal BLUE line is a area of potential support since BUYERS have stepped in each time $MOS has traded down to this level.

The ORANGE lines indicate the short term trend channel that $MOS is currently trading in.

The other stocks in this sector are on the move so we are waiting to see what $MOS does in the days to come.

The push lower on INCREASED VOLUME we saw on Thursday was followed by an "inside day" on lower volume.

We consider this a "stall" and will wait to see how $MOS trades out of this chart pattern.

For the DOWN TREND to continue we would need to see PRICE move lower and VOLUME move higher.

Price would have to break through the previous support area and VOLUME (heavy selling) should accompany that to make it happen.

What would an UP move need to look like for us to take a trade?

A BREAK OUT of the ORANGE CHANNEL on INCREASED VOLUME would be a nice trade set up for us.

This would be an STS trade since there is still some overhead resistance to deal with.

Lets see how $MOS does over the next few days and come back to walk through it together.

** Part 2 is posted HERE**

We hope you find this Swing Trading Technical Analysis walk through helpful!

Swing Trading BLOG – Week in Review – April 29, 2011

Saturday, April 30th, 2011

Swing Trading BLOG – Swing Trading BOOT CAMP

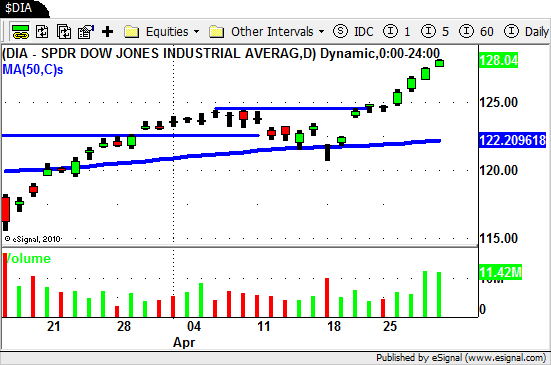
$DIA

UP, UP and Away!

The markets continued to rally this week as the DJIA and the S&P 500 traded to NEW HIGHS!

This was a great week for Swing Traders.

Not simply because the markets went higher but more importantly it was the WAY that they moved higher.

There were some great chart patterns to trade this week and most of them played out in text book form.

The price action and volume swing trading techniques that we use (and teach) painted a crystal clear picture this week.

Want to see what we mean?

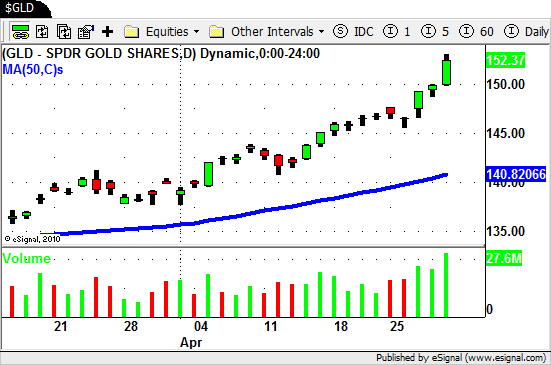
We have been focused on the Gold and Silver ETF's lately and $GLD had a great chart pattern to trade this week.

Here is a look at the chart…

$GLD

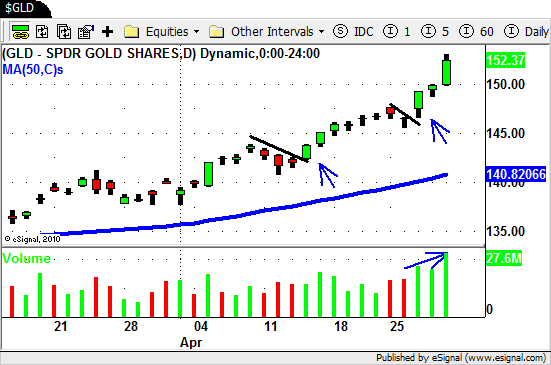
Learning how to read price action AND volume together is a powerful skill set to add to your trading.

The BLACK lines on the chart below are "pullbacks" in the obviously strong, trending Gold ETF.

$GLD

This weeks "pullback" actually consisted of two days…a high volume reversal day on Monday and day that traded lower on Tuesday.

Wednesday offered another opportunity for Swing Traders to enter into this rally.

The GAP UP was the first clue that the next move higher was upon us.

The opening price ($147.38) on the GAP UP was just below the previous Swing High set on Monday ($147.58).

By NOON time $GLD was rallying through that previous Swing High and the VOLUME was flowing into this ETF.

$GLD continued to rally the rest of the week and the VOLUME that accompanied the move was exactly what we like to see in a strong move.

There were several great examples of strong stocks with great chart patterns to trade this week.

Stay tuned to the BLOG and we will post some of the other trades we made.

Until next time….Good Trading yo YOU!

© Swing Trading Boot Camp 2024