Archive for the ‘Price Action Trading’ Category

Swing Trading Week in Review – March 2, 2012

Friday, March 2nd, 2012

Swing Trading BLOG – Swing Trading Boot Camp

$DIA - Swing Trading ETF

Going nowhere in a hurry!

Swing traders watched as the Dow Jones Industrial Average (DJIA) flirted with 13,000 again this week. 

Disappointment set in though as the market failed to make a significant move to the up side.

The NASDAQ did a bit better by rallying up to new highs.

The individual sector again was mixed.

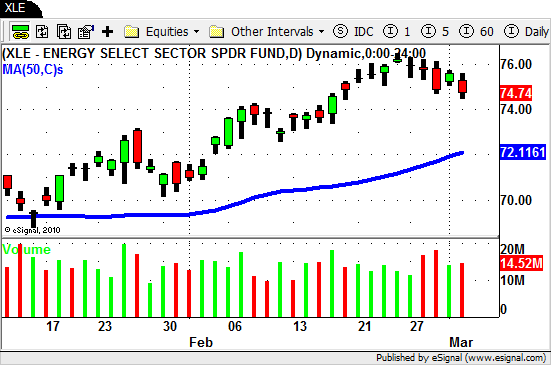
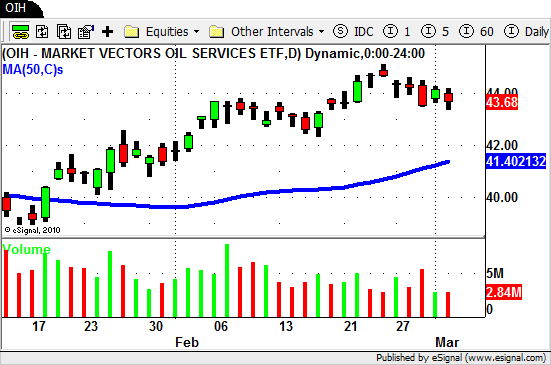
Energy ($XLE) and Oil ($OIH) pulled back this week after a nice rally.

$XLE - Swing Trading ETF $OIH - Oil Services ETF

The Retail ($RTH) and Financial ETF's are sitting at new highs while Real Estate ($IYR), Steel ($SLX) and the Semiconductors ($SMH) are well off their recent highs but still holding their 50 day SMA's.

The Gold ($GLD $GOLD $GDX) and Silver ($SLV) ETF's were a different story.

After showing signs of strength early in the week both sectors got hammered after "the Fed" comments on Wednesday.

Stocks were mixed as well this week.

There are plenty of rock star stocks out there.

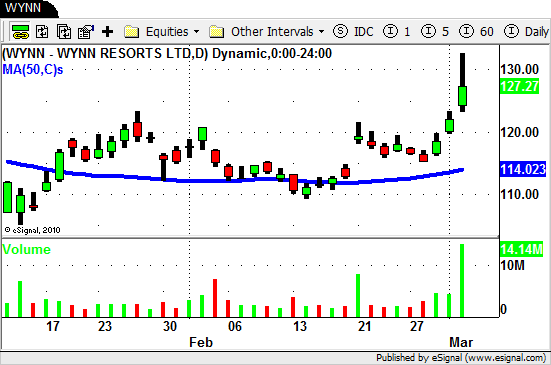
$ADBE $WYNN $AAP $ORLY and the ever impressive $AAPL.

$WYNN
All in all this week was a bit frustrating as traders watched for a strong move that never came.

It is still a very bullish market but there are a few signs on slowing in some of the sectors.

Can this market find its legs again?

No one knows for sure but as always be prepared for whatever the market decides to do from here.

Until next week…Good Trading to You!

Swing Trading Week in Review – February 17, 2012

Sunday, February 19th, 2012

Swing Trading BLOG – Swing Trading Boot Camp

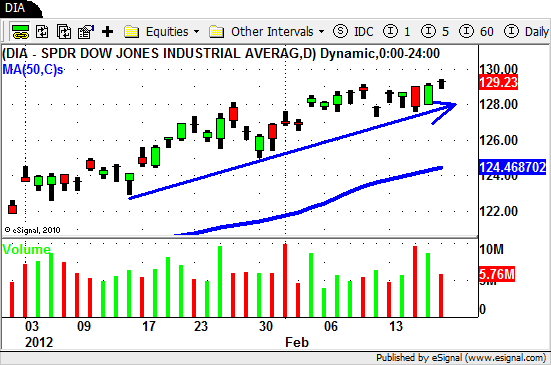
DIA - Swing Trading

Creeping Higher!

The market rallied to new highs again this week but it was a little slow in the making.

Monday traders watched as the market GAPPED UP and a decent GAP DOWN last Friday.

Tuesday we watched as the market sold off all day only to put in a rip to the close the last 30 minutes of the day.

Wednesdays price action put a lot of fear into the market and had most traders talking about a sell off.

The market spoke loud and clear on Thursday though as it ripped right out of the gate and closed near the high and above the high of Wednesdays trading.

This is why we always form our own opinions by listing to what the market is telling us. We never try to outguess the market.

Did Wednesdays price action and volume tell us anything?

Of course it did.

But we executed our trading plan accordingly and let out LONG trades play out despite all the talk of the "sell off" that was now upon us.

We did NOT change our plan and exit our positions based on what we thought "might" happen.

We were rewarded nicely for being so disciplined.

If you "hit the bid" on Wednesday you might find yourself now chasing stocks up or waiting for the next move to happen.

Stocks and obviously very bullish right now but there will be a retrace in the market sooner or later.

As we look forward trading on Tuesday there are plenty of stocks setting up for potential trades.

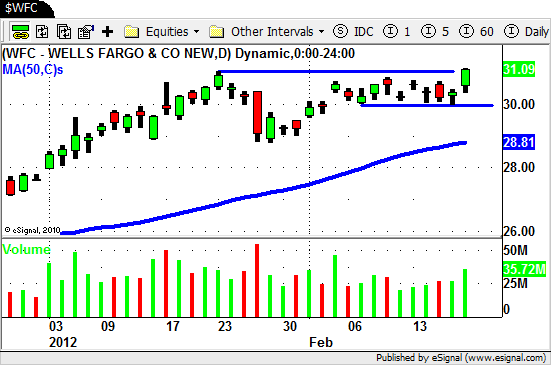
A few on our Watch List?

$WFC - Swing Trading Blog

$M $CBRL $WFC $DOW $RIG $HAR to name a few.

Until next week…Good Trading to You!

Intraday Swing Trading Stocks and ETF’s

Tuesday, February 14th, 2012

Swing Trading BLOG – Swing Trading Boot Camp

Today I thought I would take some time to show you some examples of our Intraday Swing Trading strategies.

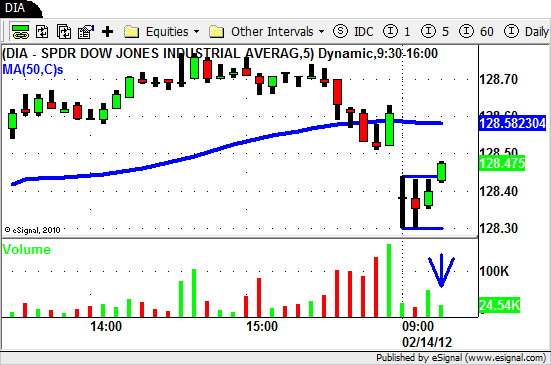
Lets first take a look at the Diamonds ($DIA) to see how the market started out this morning.
DIA - Intraday Swing Trading

In the chart above you can see how the market GAPPED DOWN opening well below yesterdays close.

You can then see the two bars after the open are "inside bars" and this gives us a nice pattern to trade once we get a breakout.

We always wait 15 minutes (3 bars) to allow the market to establish itself before we look to enter into a trade so this was a good setup for us.

As volume starts to pick up Bar #4 creates a BREAKOUT to NEW HIGHS.

Both price action (3 bar break) and increasing volume are exactly what we need.

We looked around and there were plenty of stocks with a similar pattern to trade.

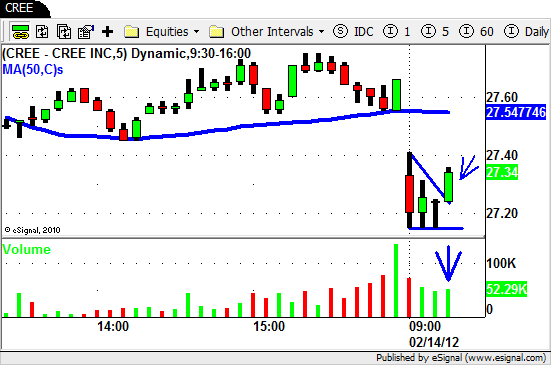
Along with $DIA $CREE stood out as a LONG trade to us with a nice pattern and defined risk.
$CREE - Intraday Swing Trading

Again the price action was good and volume was increasing.

The overall market (and $CREE) continued higher but then stalled out bit.

As an Intraday Swing Trader you have to nimble and and react quickly when the market shows signs of changing gears.

This type stalling action we see after a GAP DOWN is a flashing caution sign for us.

At this pivotal point of change you also need to scan the market to locate potential trading opportunities.

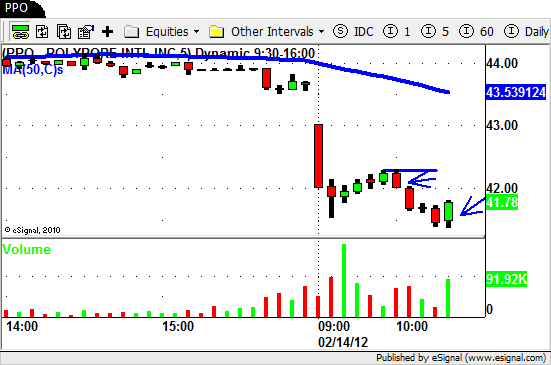
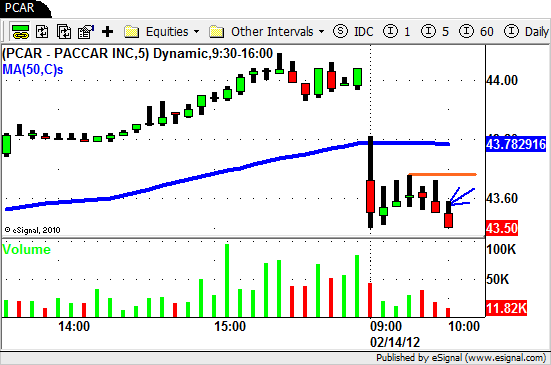
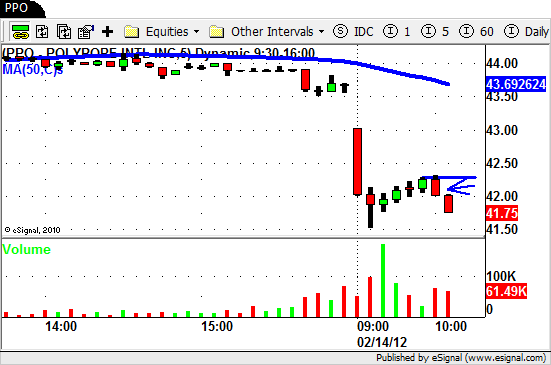
When the market "stalled" we began looking for stocks that were weaker than the overall market (relative weakness) and found $PCAR and $PPO.
$PCAR - Intraday Swing Trading $PPO - Intraday Swing Trading

Both stocks GAPPED DOWN with the overall market but never rallied to new highs when the market did.

Both stocks also created a very nice "lower higher" setups after an orderly retrace from their initial low of the day.

As the market begin to fall apart the selling volume started to accelerate in $PPO and $PCAR triggering trades in both stocks.

Our LONG trades were not looking good but we actually got out of $CREE with a profit.

Once the market broke to down to NEW LOWS we were now in SHORT mode.

Both $PPO and $PCAR pushed lower as well before showing signs of a retrace.
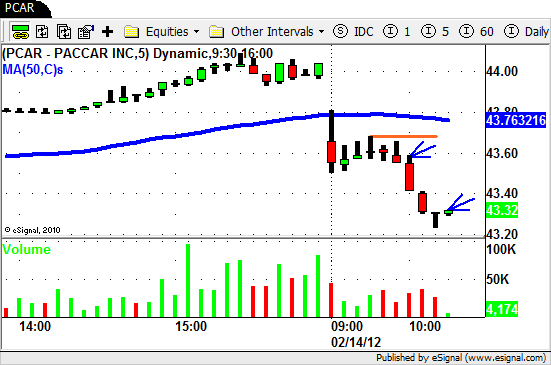
$PCAR $PPO

A few bars later and after a retrace off of the lows the $DIA was setting up for a move lower.
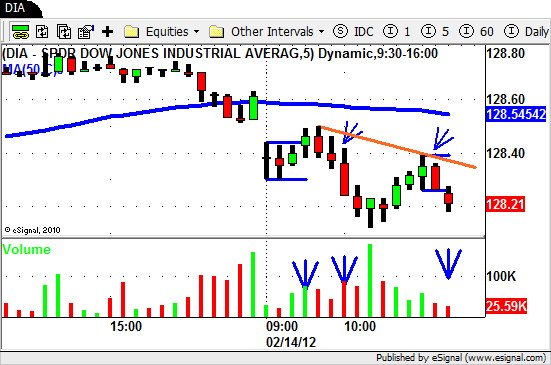
$DIA

$CREE eventually sold off with the market pushing down to a new low for the day.

$CREE was also now setting up nicely for a good SHORT trade.

The "lower high" was established and we were now able to draw our DOWN TREND lines to create a nice channel for context.

This is classic PVT trading!
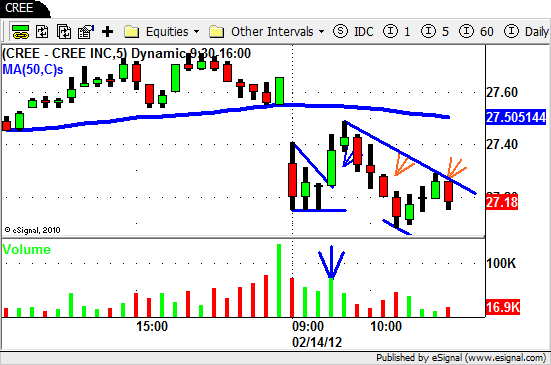
$CREE - Intraday Swing Trading

$CREE followed through nicely to the down side and created a "lower low" as the sellers stepped in.
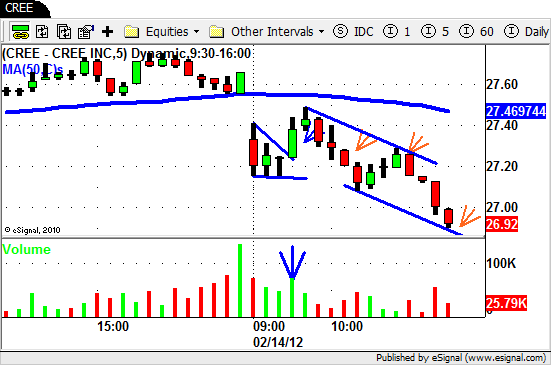
$CREE - Intraday Swing Trading

$CREE pushed through the bottom of the channel expanding it a bit before showing signs of a retrace.

The price and volume action on the last bar in the chart below shows tell tale signs of the move coming to an end.
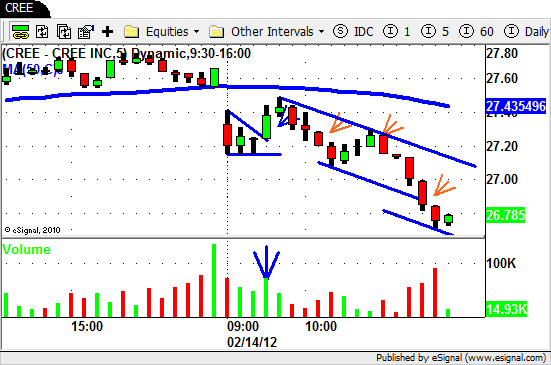
$CREE - Intraday Swing Trading

Since we only trade the first two and last tow hours of the day we were now "flat" as the market began to retrace just after 11am.

Here is a summary for our morning.

We went from LONG to SHORT in a few stocks and identified stocks that were weaker than the market.

Once the market "stalled" and began showing signs of breaking down we took trades in these "weaker" stocks.

The market followed through to the down side and these weak stocks sold off nicely.

After making new lows the market setup for another move lower which allowed us to enter into several new trades that worked out as well.

Hopefully this walk through gives you some insight into how we swing trade intraday.
Swing Trading BLOG – Week in Review February 10, 2012

Sunday, February 12th, 2012

Swing Trading BLOG – Swing Trading Boot Camp

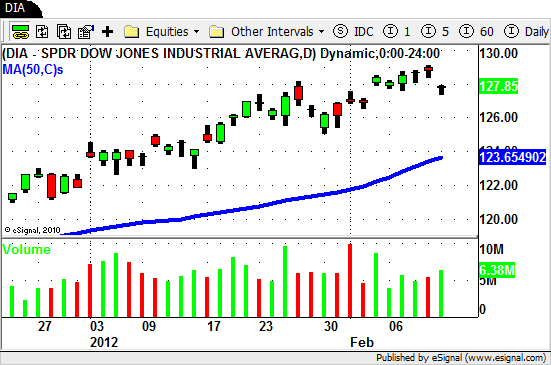
$DIA - Swing Trading ETF

The Rally continues but…

The market drifted higher this week extending the rally that started at the beginning of the year.

So where does the "but" come in?

Well Fridays price action left swing traders wondering if the market has reached its peak (at least for now).

Friday traders watched as the market GAPPED DOWN and sold off in the morning only to rally and close at its high.

The sector action was interesting as well. We watched as some of the strongest sectors either "stalled" or began to pullback even as the overall market pushed higher.

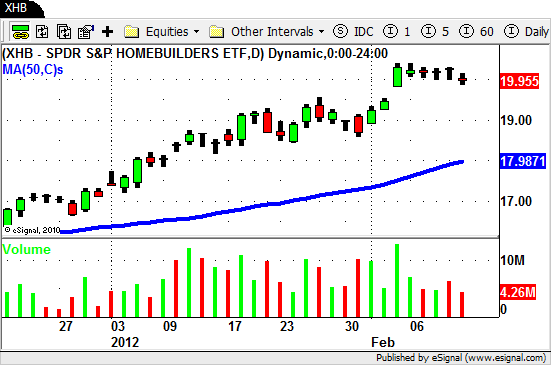
The ultra strong Homebuilders ETF ($XHB) traded sideways all week.

$XHB - Homebuilders ETF

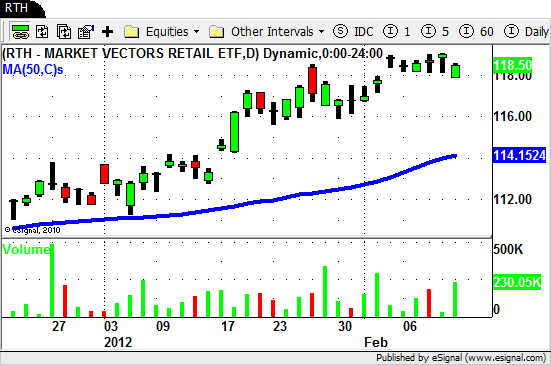
The Retail ETF ($RTH) did the same.

$RTH - Retail ETF

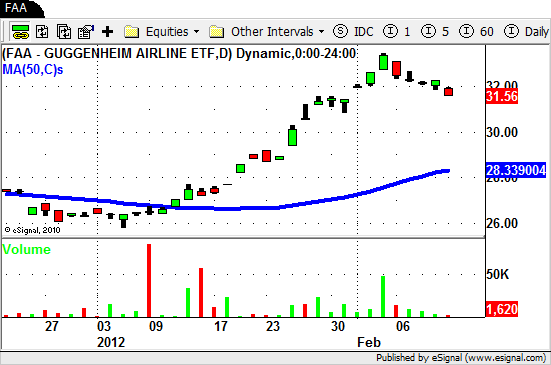
The Airlines ($FAA), Real Estate ($IYR) and Materials ETF's all started to retrace this week.

$FAA - Airlines ETF

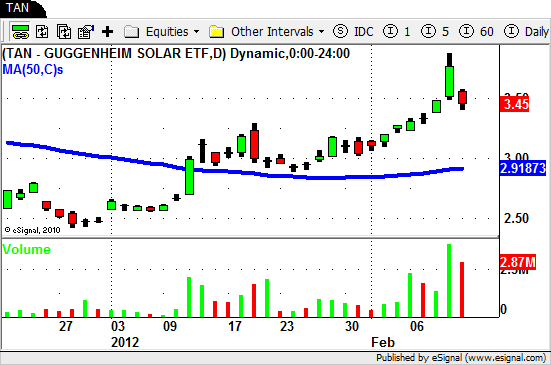
One sector to watch that outperformed the market this week was the Solar ETF ($TAN).

$TAN - Solar ETF

As far as individual names go there were some great moves and the charts still look great.

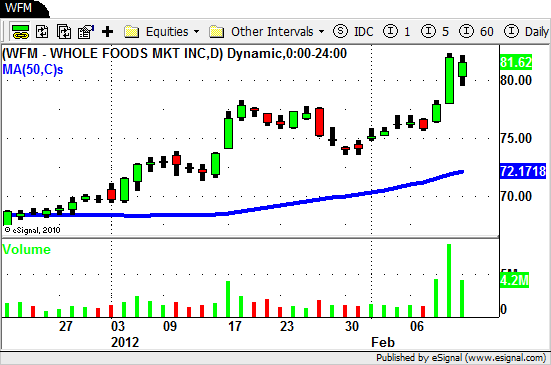
$NE, $HAR, $AKAM, $V, $VECO, and $WFM turned in a great week!

$WFM - Swing Trading Stocks

As we look at the swing trading charts we see a lot of stocks that are still looking very bullish.

Some of the best swing trading indicators are flashing signs of being "overbought" though.

The overall market does continue to show signs of being a bit extended and Fridays trading action leaves us wondering what next week will bring.

So what do swing traders do in a time like this?

Stay true to your plan.

You see  we always have a plan…and so should you!

We know exactly what we will do if the market turns down to make a run back towards the 50 day SMA.

We also know what we will do if the market jumps out of the gate on Monday and rallies to new highs.

We have our plan in place well before the market opens each and every day.

Do you know exactly what you will when the market opens on Monday?

Have a plan in place BEFORE the market does whatever it is going to do.

Once it does simply take action based on the plan you have already laid out.

Not only is trading a lot less stressful when you do this it also helps take the emotion out of your trading decisions.

Until next week…Good Trading to YOU!

© Swing Trading Boot Camp 2024