Archive for the ‘Price Action Trading’ Category

Swing Trading Week in Review – August 17, 2012

Sunday, August 19th, 2012

Swing Trading BLOG – Swing Trading BOOT CAMP

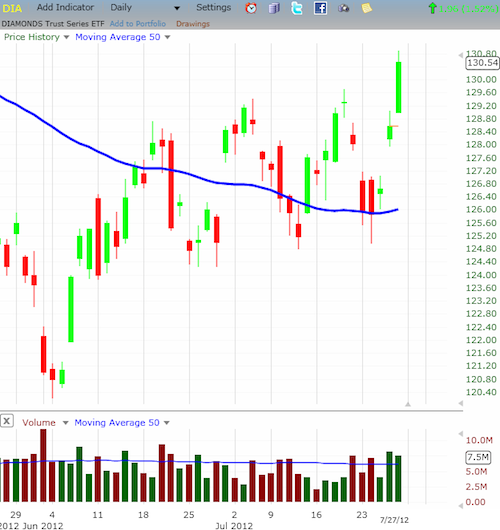
$DIA - Swing Trading BLOG

The sloooooow grind continues…

Swing Traders faced more of the same this week as the market is slowly making it's way higher.

For the last 2 weeks the move has been more of a crawl than a true breakout.

The DJIA as been a "turtle" but the technology focused NASDAQ has been moving up nicely.

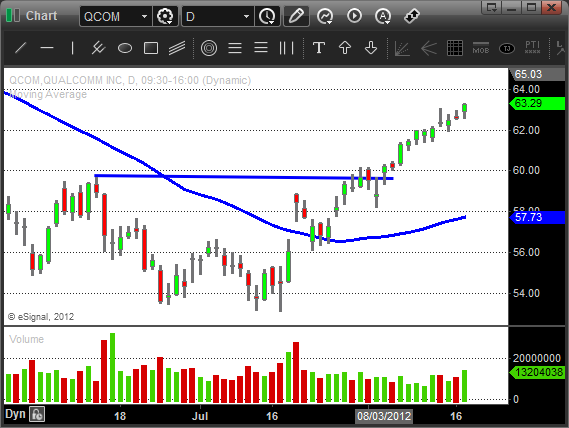
When we look deeper into the tech sector we can see names like $AAPL and $QCOM making some nice moves while the tech/retail stocks like $AMZN also followed suite.

$QCOM - Swing Trading Chart Patterns

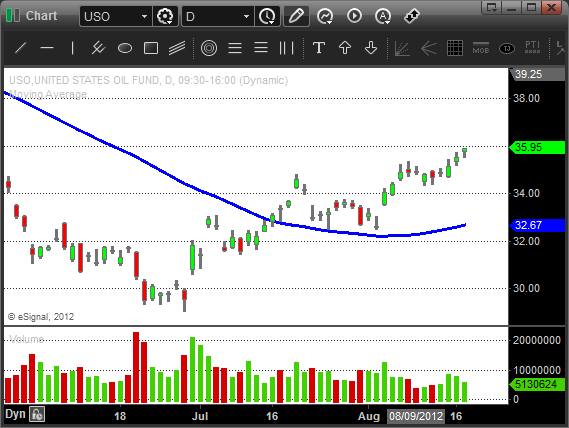
The recently strong Energy and Oil sectors showed signs of life again on Thursday.

$XLE, $USO, and $OIH all moved to multi month highs to end the week.

$USO - Swing Trading ETF

The Retail sector ($RTH) also broke to new highs this week.

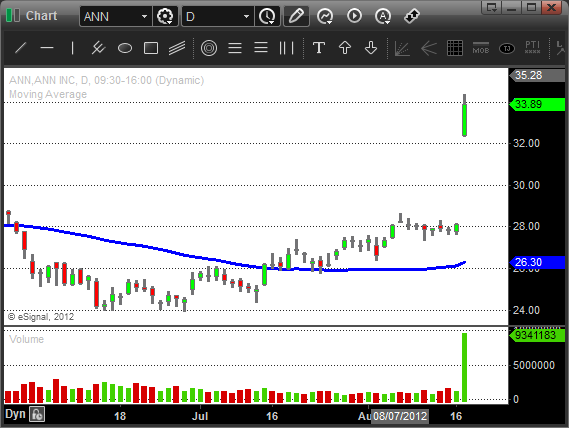
$TGT, $WMT, $RL and $M all had nice moves and if you were lucky enough to be LONG $ANN the GAP UP was a nice surprise!

$ANN - Swing Trading Chart Patterns

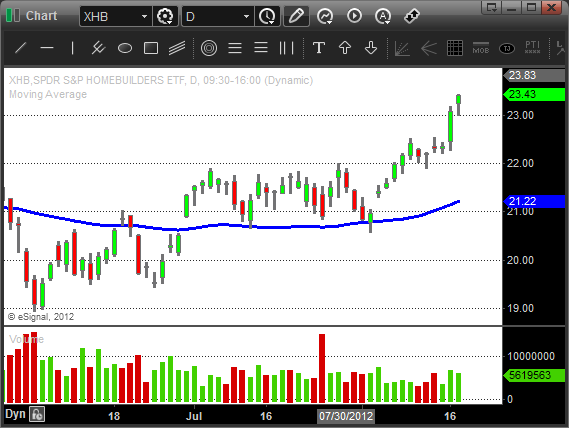
The Financials and Homebuilding sectors are playing along as well.

$XHB - Swing Trading ETF

Plenty of choices to make on the LONG side no matter what your trading strategy is.

All in all this has been a great move up in the market since we bottomed out in early June.

Once we cleared the sideways trading early this month the wind has been at our back.

With that being said both the S&P and NASDAQ remain in extremely short term overbought territory.

Be cautious as we move into next week and don't chase trades…let them come to you.

Until next week…Good Trading to YOU!

Swing Trading Week in Review – July 27, 2012

Sunday, July 29th, 2012

Swing Trading BLOG – Swing Trading BOOT CAMP

DIA - Swing Trading Strategies

And off we go!

Traders watched as the recently stop and go market finally got up and went.

After weeks of indecision (with a bullish skew) the markets finally picked a direction in a big way this week.

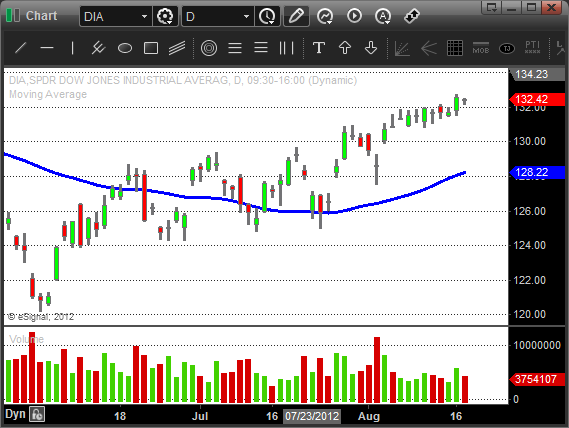
The most recent pullback brought the market back (once again) to their 50 day moving average to start the week.

After finding some support there the market once again found its footing and moved back up on Thursday.

Friday traders watched as the markets GAPPED UP and finally broke out above there short term overhead resistance levels.

The chart pattern was sound.

The support at the 50 day SMA. Confirmation of a higher low on Thursday. Continuation and BREAKOUT on Friday. 

The UP TREND continues!

As a swing trader you have to recognize these chart patterns and take action when they present themselves.

Although the overall market has been a bit chaotic you should have had some on the strong stocks and ETF's on your Watch List.

Once you noticed the potential of the market finding support around the 50 day you had to start thinking about the LONG side of the market.

ETF's that have been STRONGER than the overall market and a good place to start.

Take a look at the Oil and Energy ETF's ($XLE $OIH).

Stronger than the market and great chart patterns to trade.

Look at the charts. Study them. Take a look at the price action and volume. Damn near perfect patterns to trade.

Drill down to find some stocks in those sectors and you find the same thing.

$MRO and $SUN had some nice follow through after pretty text book setups. 

Once again price action and volume paint a very clear picture.

The Retail sector ($RTH) also broke out to NEW HIGHS this week.

We have been talking about $WMT for weeks and this week had yet another opportunity for a profitable swing trade.

There are still plenty of "lagging" sectors but if the market continues to strengthen you might look for clues that these sectors are turning.

This most recent move in the market brings us back up to a level that will obviously entice some sellers.

Don't be afraid that you will miss the bus if you are looking to get long.

Let the trades come to you and take action once they do.

Pay close attention to the clues (price action and volume) that the market gives you and be prepared for anything.

Next week should be fun!

Until then…Good Trading to YOU!

Swing Trading Week in Review – July 13, 2012

Saturday, July 14th, 2012

Swing Trading Blog – Swing Trading Boot Camp
DIA - Swing Trading ETF Strategies

Price action and Volume always tells a story.

Once you understand how price and volume work together you can start to understand the "flow" of the market.

Doing so can often time keep you out of trouble by helping you define the right side of the market.

This week was a good case in point.

It was very obvious that there were some traders who got caught SHORT and had to cover during the rally on Friday.

By understanding that the market was in a retrace in a short term UP trend those traders might have been able to avoid some losing trades.

Now if you only typically hold positions for a day or two this might not be a problem. We know because this is the average holding period for our own STS trades.

The price action of the market moves in waves. If you are familiar with Elliot Wave Theory you will know exactly what we are talking about.

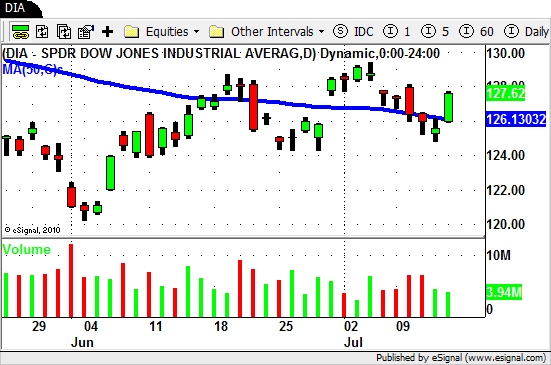
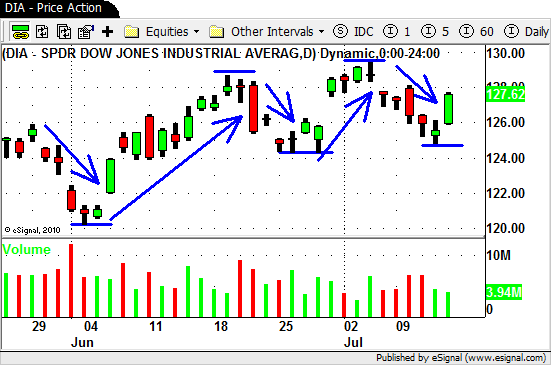
Take a look at the current chart of the $DIA below to see what we mean.
DIA - Price Action Trading

Notice how the market moves in one direction for awhile then the other in a wave like pattern.

Starting in early June you can see how the market rose until just about the middle of the month.

Then the market moved the other direction (down in this case) for a few days before moving up again at the end of June into early July.

Notice that the move this time was higher the the high in mid June…a true higher high chart pattern.

July 5th was the top of that move and once again then market begins to go down again.

This is called a retrace. Price is retracing its previous steps or moving in the direction after a move of strength.

On Friday price starts to move higher again (after a retrace) putting in a higher low.

This wave type price action pattern of higher highs and higher lows is what Technical Analysts and traders define as a classic UP TREND.

Based on that knowledge we can see that the $DIA has been in a UP trend since bottoming out in early June.

We also now know the right (or strong) side of the market is to the LONG side.

We can also understand that the move we were in until Thursday was a retrace in this UP trend.

Now if your trading strategy considers the overall trend of the market you would know that, at some point, this retrace would end and price would once again move higher.

We may not know for how long but it will in fact move higher at least temporarily.

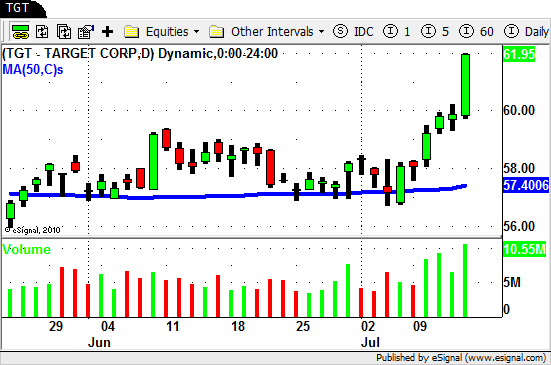
Take a look at some of the strongest stocks in the market ($TGT, $WMT) and notice how they basically shrugged off the entire retrace…an obvious sign of relative strength.
TGT - Swing Trading Strategies

These are type of charts patterns we want to focus on as short term traders. Stocks stronger than the overall market that start to take off despite an obvious pullback in the overall market.

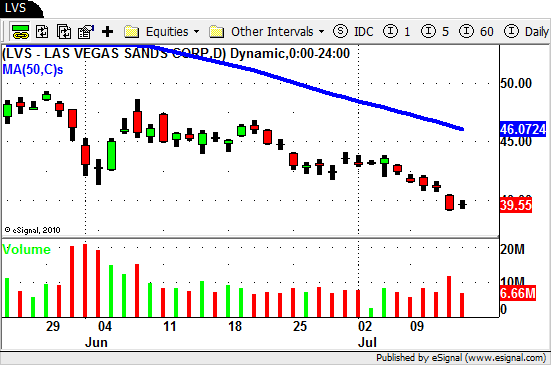
The SHORTS trades we did notice had charts that looked like death. Take a look at $MGM $LVS and $BRCM.
LVS - Short Swing Trading Strategies

Notice that these stocks are weaker than the market and, for us, SHORTING them was an appealing option.

Although the strong side of the market was the LONG side we were able to time our trades once the retrace in the overall market started.

By doing so we are essentially shorting the weakest stocks in the market when the market hovers in an area of indecision (near the 50 day SMA).

The volume we saw on Friday was on the low side.

That being said we will see if the market can sustain its upward momentum or if we a change of heart as we head deeper into earnings season.

Until next week…Good Trading to YOU!
Swing Trading Week in Review – June 29th

Sunday, July 1st, 2012

Swing Trading BLOG – Swing Trading Boot Camp

DIA - Swing Trading ETF Strategies

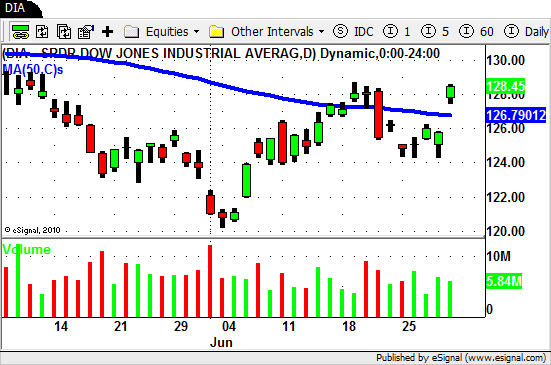
Despite two big GAP DOWNS on Monday and Thursday that market finally found its legs.

Friday trades watched as the market GAPPED UP and finished the week with a nice rally to the close.

The rally actually started at the end of the day on Thursday which gave swing traders a clue of things to come for Friday morning.

Paying attention to intraday price action can often times give you a "heads up" to what the big money is doing since  a lot of orders go in during the last two hours of each trading day.

Once we saw the rally Thursday afternoon (along with the volume that accompanied it) we were pretty sure that the market was going to lift off the next day.

This would mean that some of our SHORT positions would not follow through and would probably stop us out.

So what did we do?

Nothing. Absolutely NOTHING DIFFERENT.

Did we cover our SHORTS? Did we flip those SHORTS to LONGS?

No and No.

Simply put we traded our plan.

We have learned over the years that we should never try to out guess the market.

In hindsight it east to say that we would have been smart to COVER and even FLIP TO THE LONG SIDE but that is not always the case.

Being almost positive that you are right can cost you…big time.

Our trading plan is very specific.

We enter our trade and place our stops. We set our profit target(s) and manage our trade per our plan.

Then we let it play out one way or the another.

Either we get stopped out OR we hit our profit target.

We don't change our rules based on what we think the market is going to do.

We told you last week that we trade both sides of the market and get stopped out (on the wrong side) once the market finds its true direction.

This week was a great example of this.

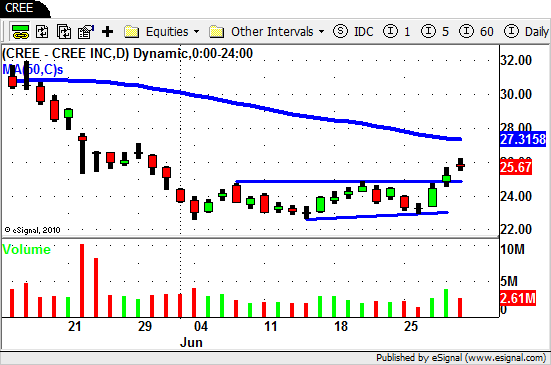
When the SHORT trades stall and STOP GOING DOWN that should tell you something.

A lot of good looking SHORT set ups didn't follow through and actually created a higher low this week.

CREE - Swing Trading Strategies

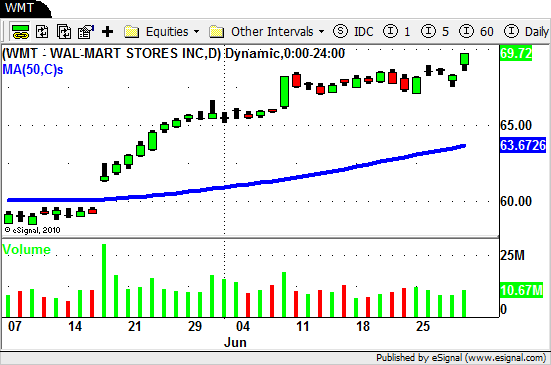
When your LONG trades are breaking out on good volume that should tell you something as well.

WMT - Swing Trading Strategies

Learning to read the price action and volume during these times is crucial to identify turning points in the market.

This is exactly what we mean when we say to "listen to the market and act accordingly".

Until next week…Good Trading to YOU!
© Swing Trading Boot Camp 2024