Swing Trading Update 06.21.19
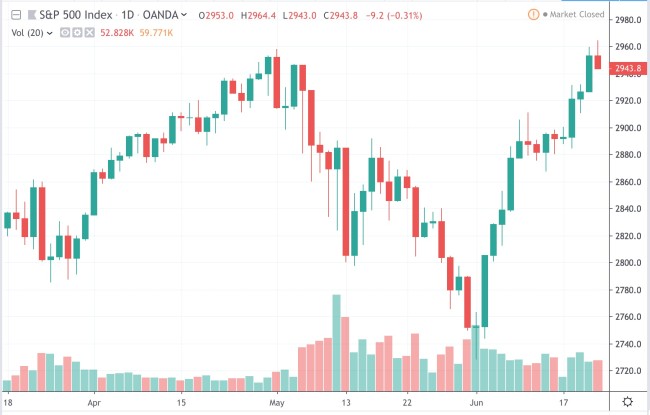
S&P 500 ($SPY)
|
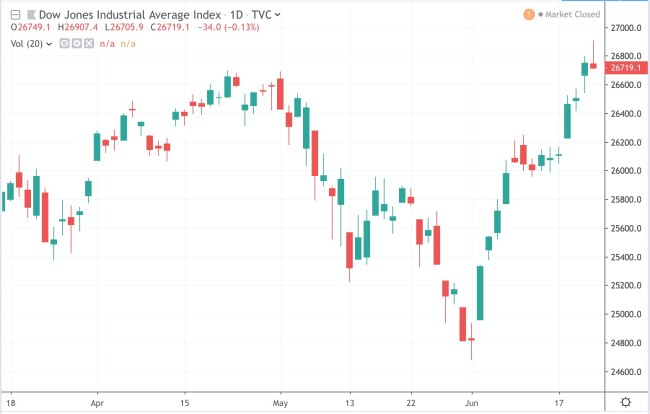
DJIA ($DIA)
|
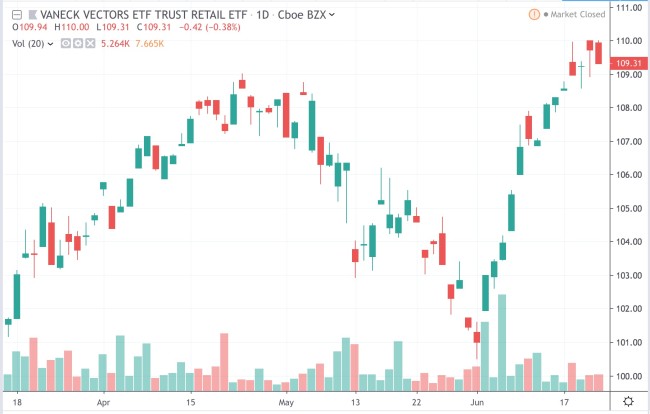
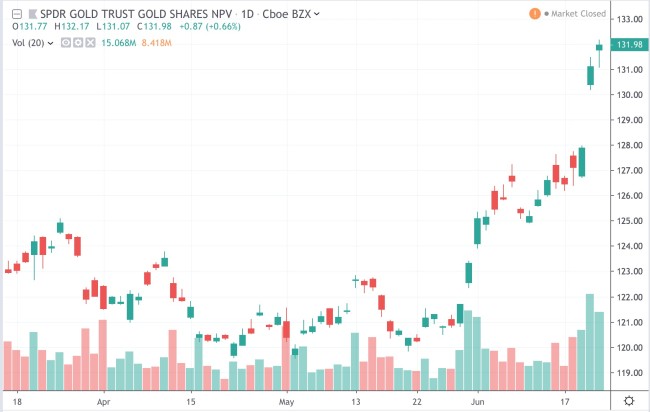
SECTOR WATCH – $GLD $RTH
|
SUMMARY
|

|

|


|
|
Well, that was an interesting week, wasn't it?
Basically, a FLAT trading day on Monday followed by 4 straight SOLID UP DAYS.
This weeks trading left a lot of traders frustrated…but should it have?
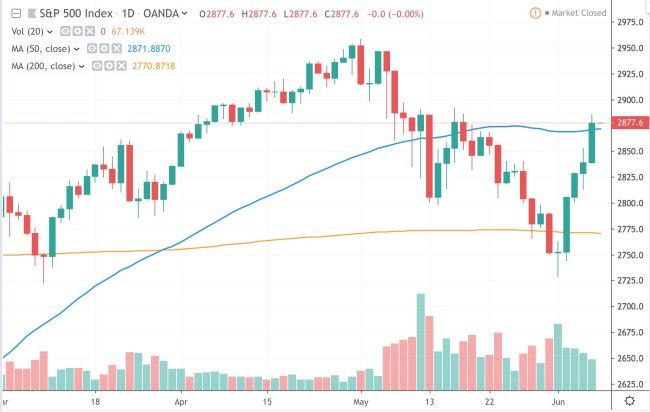
We took off like a rocket on Tuesday after trading down to a key level on Monday.
This weeks move brought us right back up to the 50-day MA although it was on decreasing volume.
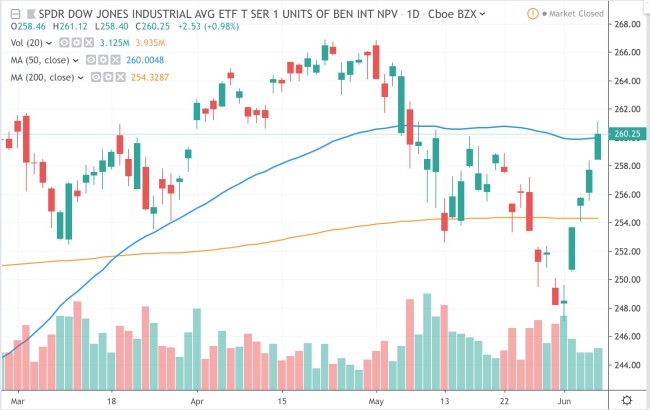
Same story here in the DJIA.
FLAT Monday and 4 days up right back to the 50-day MA.
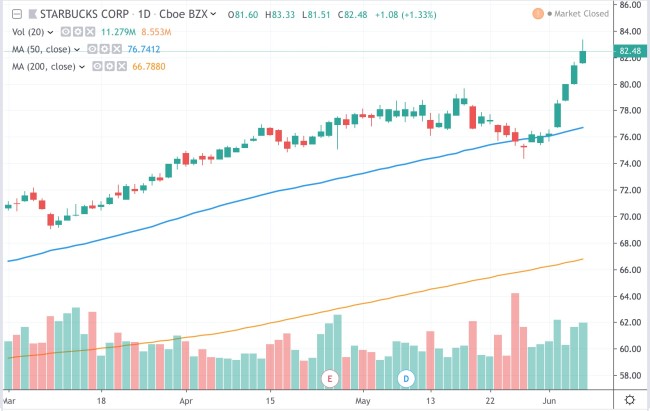
There were some strong stocks like $SBUX on the move to the UPSIDE this week after showing relative strength to the overall market.
Other strong stocks bucking the trend included $V, $LLL, $WMT, $DIS, $CB and $MA to name a few.
So should this week have frustrated so many traders?
Well, I guess that depends on your strategy.
If you were SHORT and you are a LONGER TERM SWING TRADER then the big retrace was probably an unwelcome one.
If you were SHORT and you are a SHORTER TERM SWING TRADER then you may have covered your SHORT positions (for a profit) during the last move down. Or maybe your TRAILING STOP got hit on the retrace. Not so bad.
If you were looking to get LONG and you were buying STRONG STOCKS (like $SBUX etc.) expecting a retrace in the market then you may have been ok.
If you were looking to get LONG and you were buying OVERSOLDstocks/ETF's for a "bounce" you were probably ok also.
So, in our eyes, there weren't too many reasons to be frustrated with this weeks trading.
The frustration just depends on your perspective (and strategy) for trading this week.
What happens from here?
Time will tell but as always don't try to outguess the market.
Let your charts tell the story and stick to your strategy…if it's a sound one.
Until next week…GOOD TRADING TO YOU!
Here is your Swing Trading update for the trading week ending 05.31.19.
After the holiday we saw a nice continuation to the DOWNSIDE in the market this week.
With lots of people expecting some sort of bounce from an OVERSOLD position the charts always tell the true story…if you know how to read them.
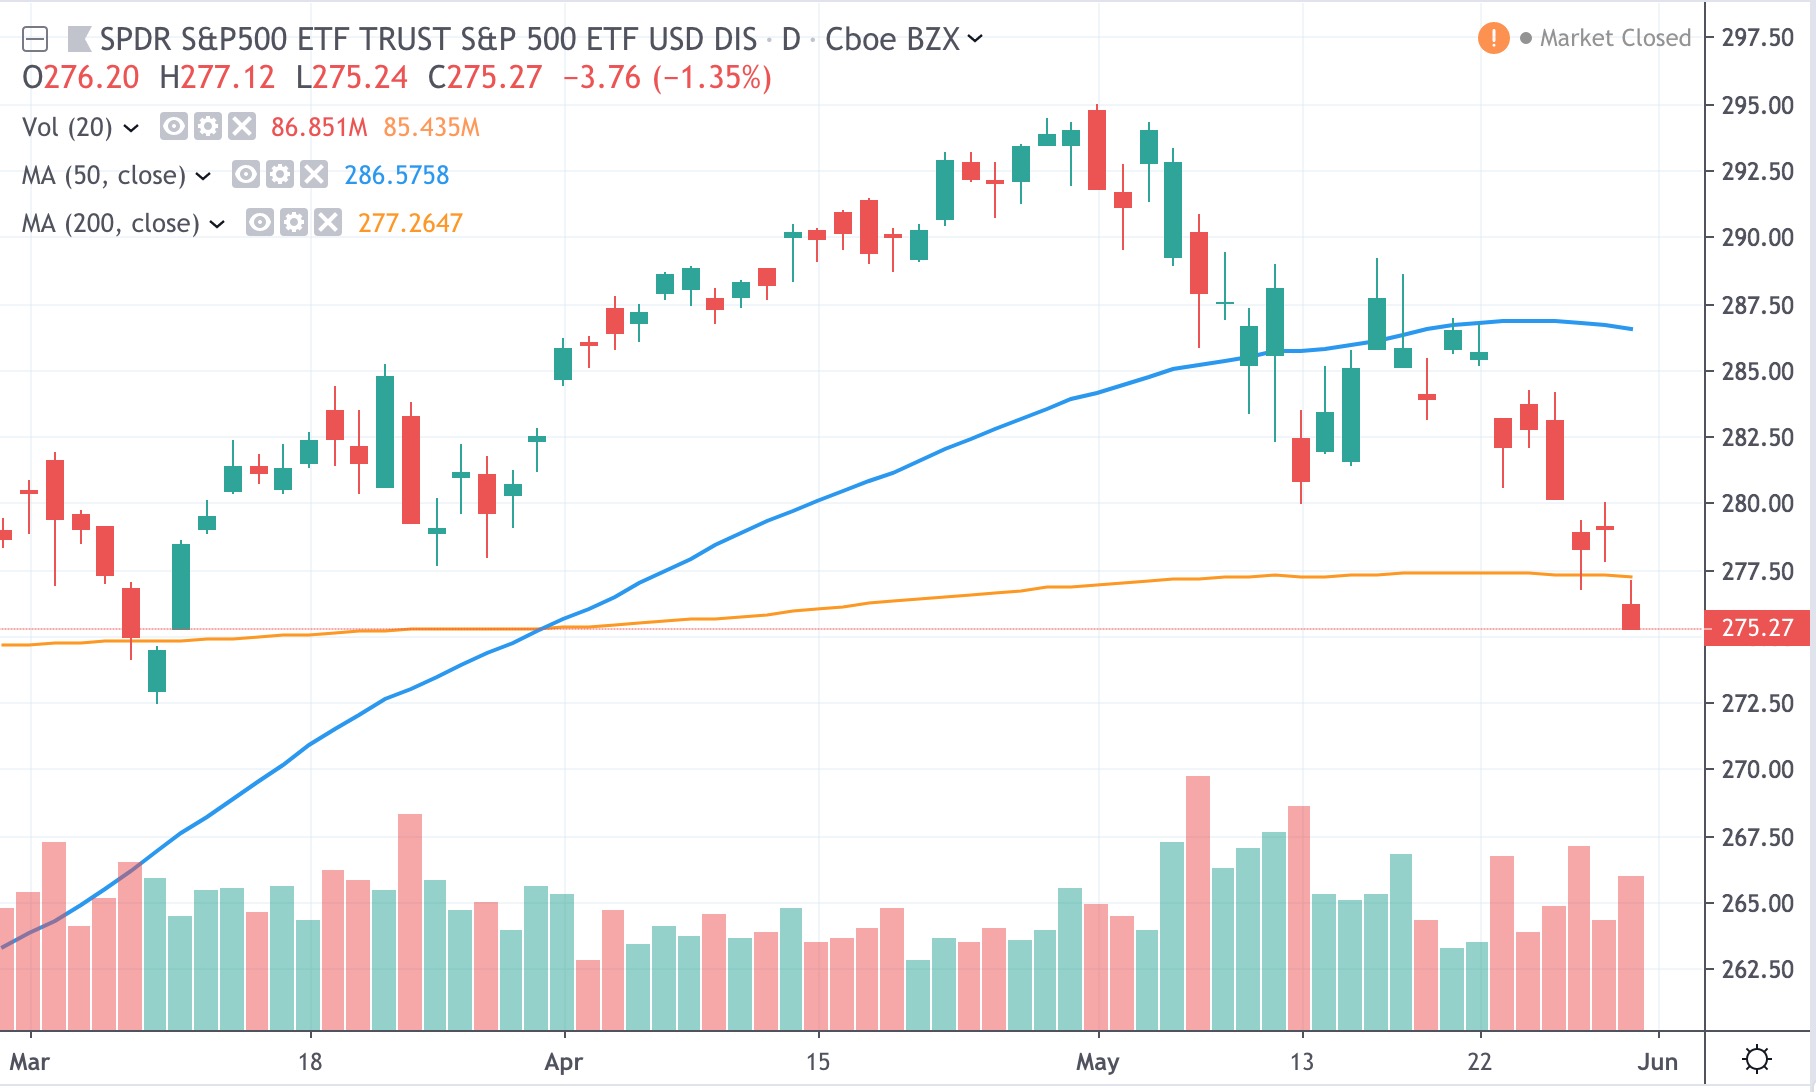
The S&P got rocked again this week (along with just about everything else.
Take a look at the chart. After pushing lower mid-week last week we saw 2 STALLbars near the LOW END of the trading range. When the market opened up on TUESDAY we saw the continued push LOWER on VOLUME, breaking down from the 2 STALL bars.
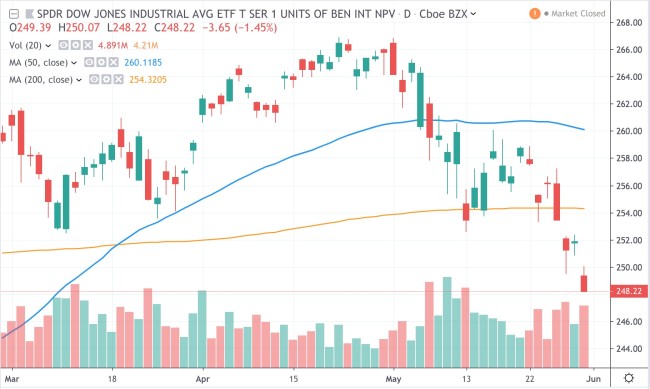
More of the same from the DJIA. Since the end of APRIL we are down 1800 points or so. Not good for the LONG SIDE especially since we are now under the 200-day MA.
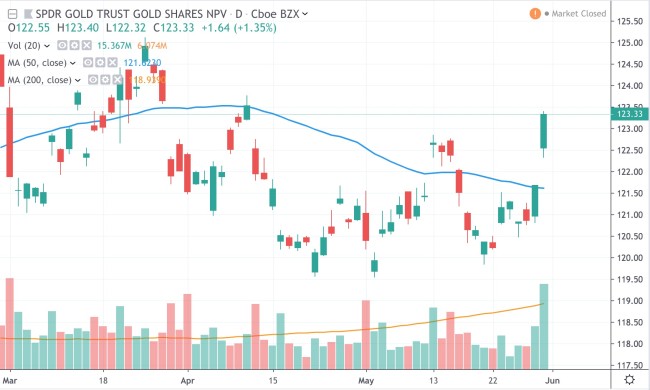
The sector to watch this week was GOLD. Considering the overall market conditions, the setup after the double bottom and pullback after 3 days above the 50-day MA setup a nice chance to get LONG (at 2 spots).
With ALL THREE INDICES (S&P, DJIA, NAZ) now trading below their 200-day MA's I would say that the writing on the wall is clear.
The failure to push to NEW HIGHS in early MAY was quickly followed by HEAVY SELLING which broke the UPTREND.
After a small bounce and stall we saw continuation to the downside this week.
And while there are still some strong stocks in the market we will wait to see if all of this selling pressure catches up to them as well.
I wouldn't chase stocks/ETF's down at this point but the next STALL or PULLBACKshould tells us how the story continues.
Until next week…GOOD TRADING TO YOU!
© Swing Trading Boot Camp 2025