Swing Trading BLOG – Swing Trading BOOT CAMP
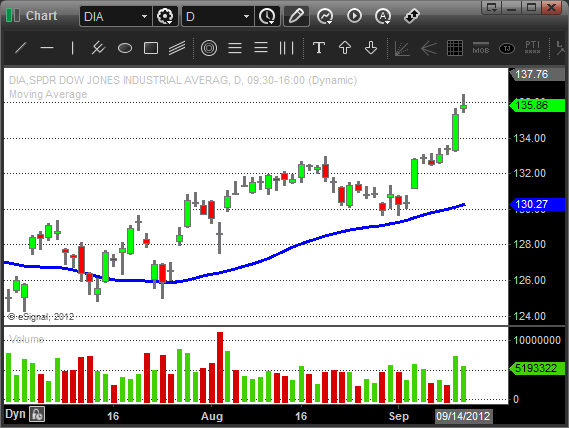
Well in case you haven't heard by now the market continued its BIG BAD RALLY this week.
After consolidating near the highs the market finally broke this the overhead resistance pushing all three indices into NEW HIGH territory.
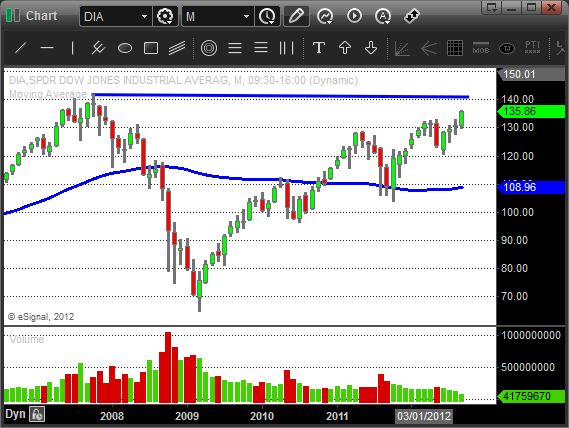
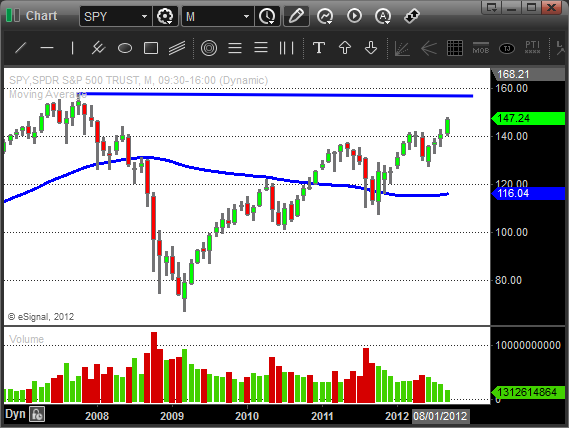
This recent move puts the DJIA and S&P close to the highs prior to the financial crisis.
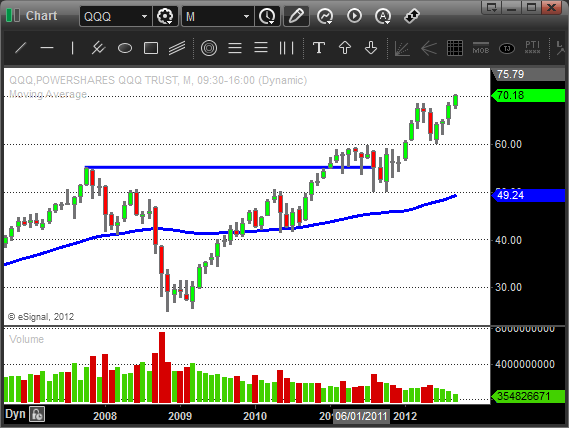
The Nasdaq is trading well above those levels.
Here is a look at the MONTHLY charts…
The DJIA…
The S&P…
And finally the Nasdaq…
As expected most sector ETF's, including the GOLD and SILVER ETF's, rallied right along with the overall market.
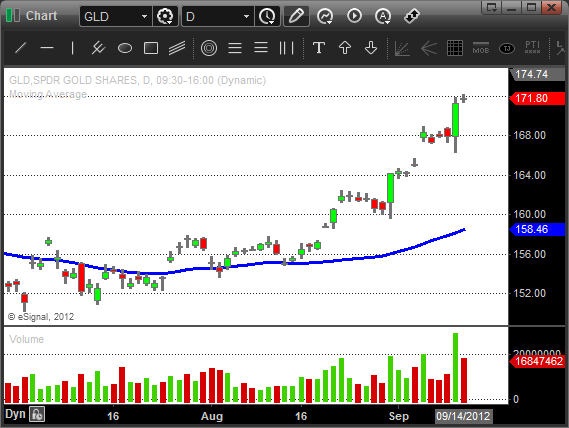
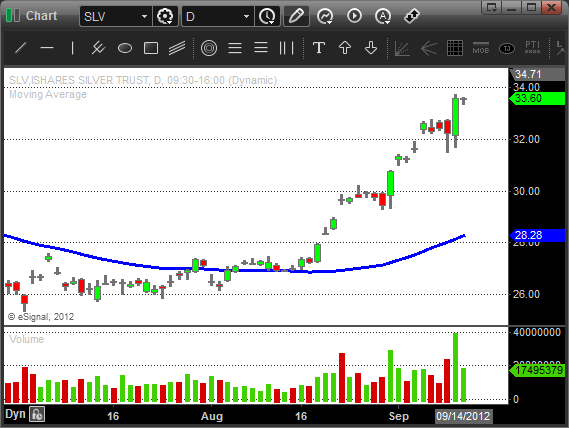
So what does all this BULLISH price action mean for short term traders?
Well for one it means you shouldn't be SHORT!
Since the market is so strong it is actually very hard, in our opinion, to find good short trade setups anyway.
Focus on your LONG list and be aware of the next level in the market.
In this case the next important "level" will be that high established back in 2007.
Day to day price action should remain bullish so pick you spots.
Last weeks post was about NOT chasing the market and letting trades come to you.
As the market becomes stronger it becomes much more tempting to do so.
The last thing you want to do is start buying at price levels where the majority of traders are selling.
Plan your trades and most importantly TRADE YOUR PLAN.
As we look through the charts we see a lot of stocks that have put in some extended moves.
That means that price has moved significantly away from an optimal entry point.
As we move into next week we will be watching the strong stocks and waiting for PULLBACKS.
Once we see these leaders pulling back we will sit and wait and see what price action and volume tells us is coming next.
Until next week…Good Trading to YOU!
Tags: Swing Trading Blog, Swing Trading Chart Patterns, Swing Trading Price Action, Swing Trading Strategies

