Swing Trading Blog – Swing Trading Boot Camp

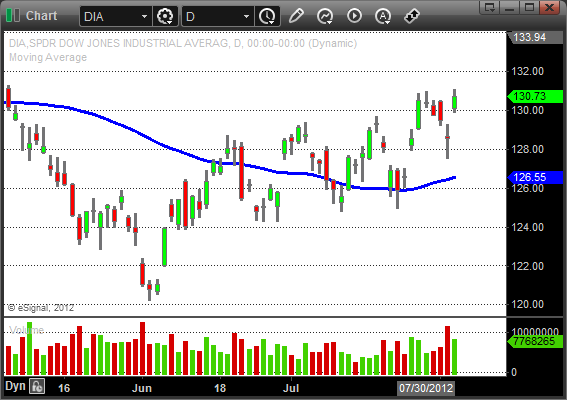
After a strong up move last week swing traders watched as the market pulled back for four consecutive days to start this week.
Fridays price action however confirms that we are still in a bullish trend.
The big GAP UP had traders scrambling to get LONG again and might have caught a few traders short.
The most recent move is technically another higher high in all three major indices.
The volume patterns indicated some heavy selling last week so lets see if the buying volume confirms this move to new highs.
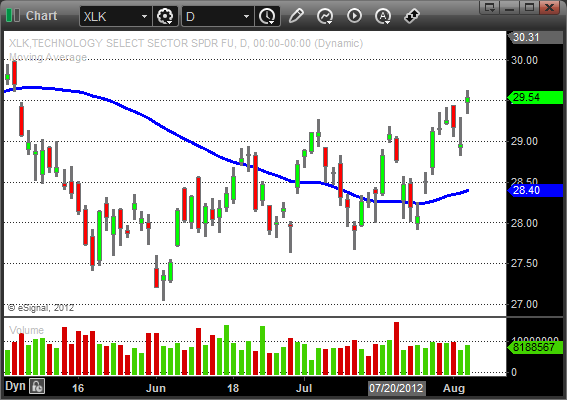
The sector action remains consistent with the strong sectors getting stronger and showing signs of moving higher.
Retail, Technology, Financials, and the Energy and Oil sector ETF's had some good chart patterns to trade.

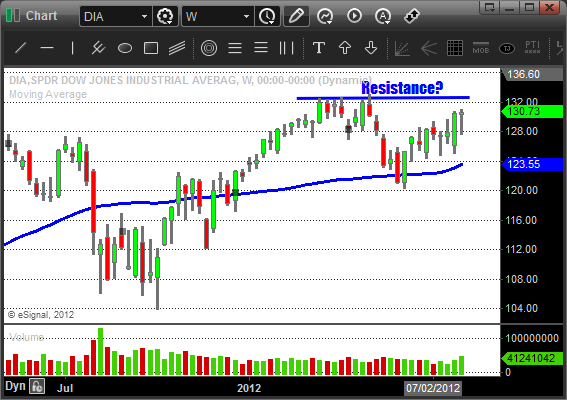
As we move into next week just be aware that we still have some substantial overhead resistance to contend with.
All three major indices put in the yearly highs in early April and then failed to move higher after that.
Here is a look at the weekly chart of the $DIA…

Look for the strongest stocks with the best chart patterns to trade.
Pay attention to price action and volume if we make a run to the April highs.
Have a plan for whatever the market decides to do from here.
Until next week…Good Trading to YOU!
Tags: ETF Swing Trading, Swing Trading Chart Patterns, Swing Trading Price Action, Swing Trading Strategies

