Swing Trading BLOG – Swing Trading BOOT CAMP

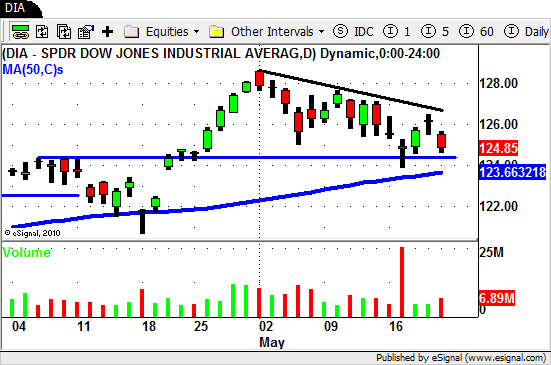
After putting a LOWER HIGH last week traders watched as the market followed with a LOWER LOW this week.
Tuesdays trading actually brought the overall market down to a new low for the month of May.
The SELL OFF pushed the market back closer to its 50 day SMA and right on top of the previous break out level we saw a month ago.
This SHORT TERM correction in the market actually gives us a nice DESCENDING TRIANGLE (see chart above) to trade it we choose to do so.
A follow up on the Sector ETF's is in order so here it goes.
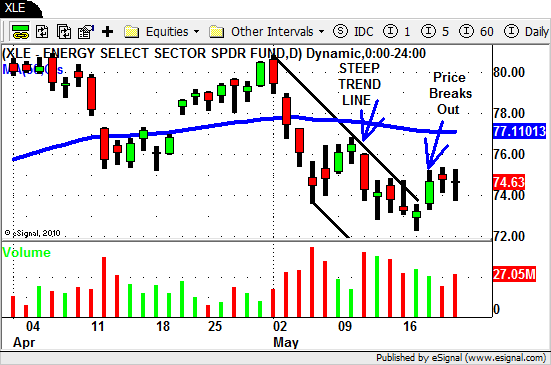
As we mentioned in last weeks BLOG POST the Energy and Oil ETF's had a very "steep" trend line in place.
These "steep" angles are hard to maintain and often times you will need to adjust your lines after price breaks out of these fast lines.

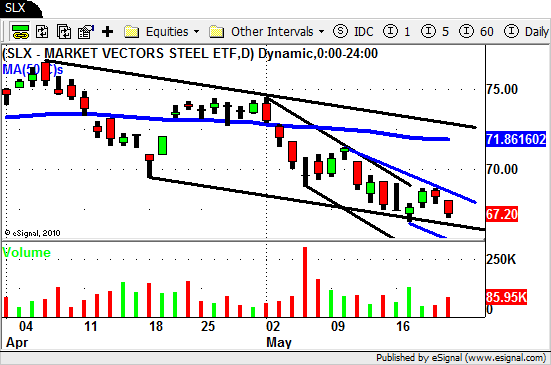
The Steel sector ETF ($SLX) is a good example of a slight TREND LINE adjustment.
In the chart below you can see how after hitting the bottom of the longer term DOWN CHANNEL $SLX "bounced" out of the SHORT TERM channel.

This "bounce" actually took price out of the SHORT TERM channel BUT it was still under its previous Swing High.
Fridays trading action confirmed the next move lower so we were now able to slightly "adjust" our trend line (in blue) to gives us context for our new channel.
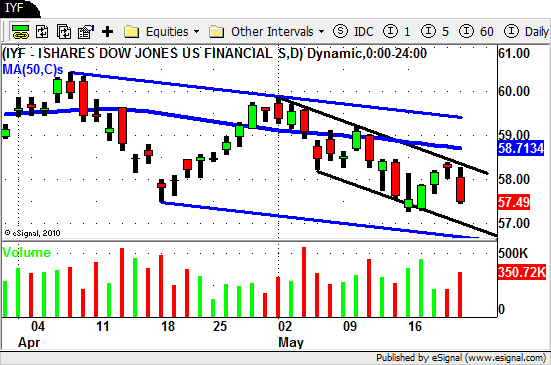
One sector that has put in a nice orderly DOWN TREND is the Financial sector ETF ($IYF).
No adjustment to this trend line…

As we move into next week we must admit that the warning signs are flashing for us.
The selling we saw on Friday is concerning to say the least but that being said the market is still holding (so far) above its 50 day SMA.
We are still trading both sides of the market and will continue to do so until the market decides where to go from here.
Be prepared for anything and have a plan in place and until next week…Good Trading to YOU!!!
Tags: ETF Swing Trading, IYF, Sector ETF's, Swing Trading, Swing Trading Blog, Swing Trading Strategies, Swing Trading Technical Analysis, XLE

