After receiving numerous inquires about the day trading techniques we use to "Swing Trade" on an Intraday chart we thought we would post a few examples from today's trading session.
Although "Swing Trading" in generally used to define an overnight strategy you can view this article to understand how we define "Swing Trading" for day traders.
Although the overall market (DJIA) finished up a mere 19 points today the intraday price swings and volatility offered plenty of opportunity for "Swing Trading" on the 5 minute chart.
Here is the 5 minute chart of the Diamonds (DIA)…
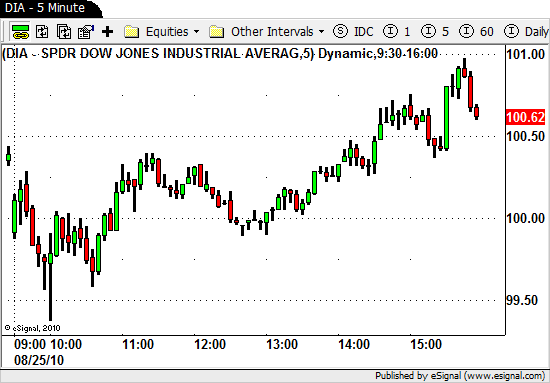
You can see from the chart above that the overall market GAPPED DOWN a bit and rolled over into the 10am number.
After the number came out the market attempted to push lower but ended up putting in a higher low just after 1030am.
After this higher low we rallied to NEW HIGHS for the day only to stall around lunch time.
Just after 2pm we again pushed to NEW HIGHS for the day and then had nice afternoon rally until the last 10 minutes of trading when we saw a the market retrace into the close.
So now that you see how we viewed the price action and chart patterns for the overall market let's take a look at some of the individual stocks and ETF's.
Since the SHORT TERM trend in the overall market was DOWN and we GAPPED DOWN we were looking to the SHORT SIDE as we rolled over on bar 3 (9:40-9:45am).
As always though we are constantly scanning the market to see which stocks are showing relative strength and which are showing weakness.
The first trade we put on this morning was in St. Jude (STJ)…
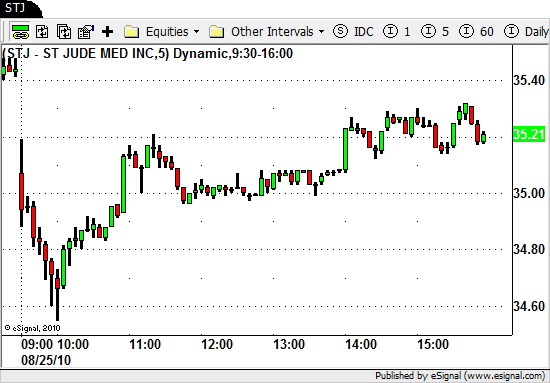
Due to the daily chart and recent news in this sector we had STJ on our Watch List this morning.
As the market moves higher on BAR 1 you can see how STJ reverses intrabar and closes near its low on the same bar.
On BAR 2 the market moves to NEW HIGHS temporarily only to rollover and close near its low and STJ creates a small "inside bar" and hardly ticks ups at all.
A good sign of relative weakness (for now).
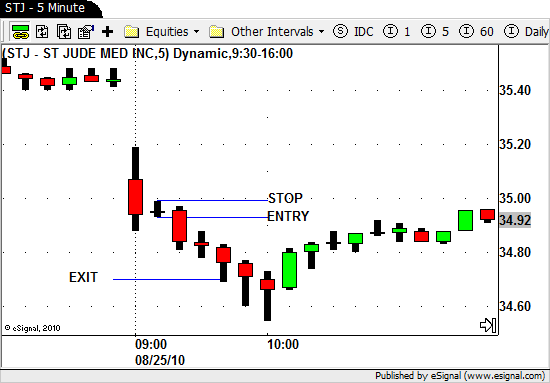
As the overall market continues to rollover to NEW LOWS on BAR 3 we had a nice SHORT setup in STJ.
For this 3 bar chart pattern we set our INITIAL STOP .01 above the high of BAR 2 at $35.
Our entry price was a few cents below the low of BAR 2 at $34.90.
We set our profit target at $34.70 and we were able to cover our position as STJ pushed lower just prior to the morning number.
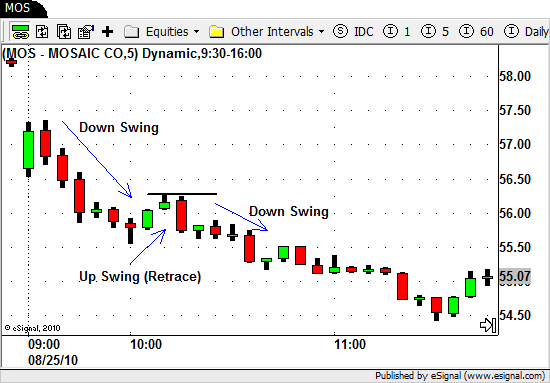
Another stock that showed some obvious relative weakness this morning for us was Mosaic (MOS)…
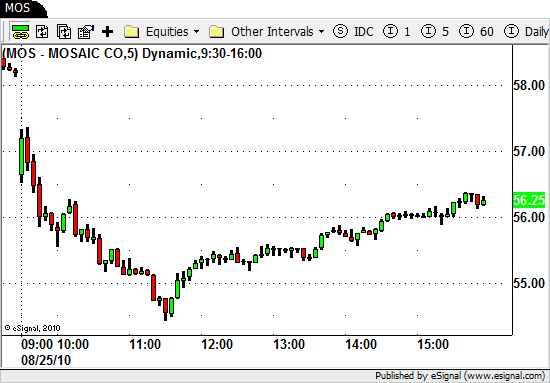
MOS rolls over with the overall market right into the 10am number.
After 10am MOS and the overall market put in a 2 bar retrace until the 10:10am bar.
We are still looking for SHORT trades at this point since the market has pushed to NEW LOWS for the day and has now retraced.
As the market stalls and trades sideways MOS starts to head lower.
This is a classic INTRADAY SWING TRADE!
The text book lower high in MOS offered us a nice opportunity to get SHORT in an attempt to profit from the next DOWN SWING in price.
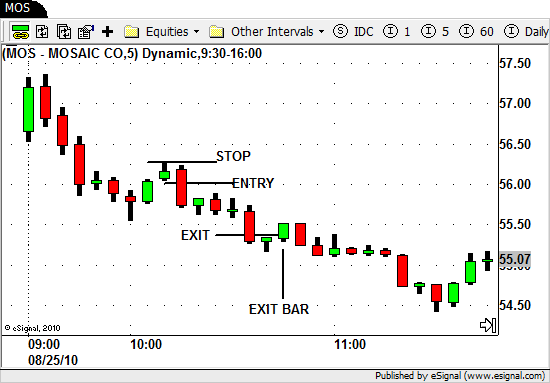
Our INITIAL STOP placed .01 above the lower high at $56.28.
Our ENTRY was just below the LOW of the bar that created the lower high at $56.02.
This set our initial risk at .26/share for this day trade.
We covered our SHORT at $55.36 (for a little over 2.5/1 reward/risk ratio) as the overall market confirmed its higher low on the 10:35-10:40am bar.
As the market confirmed it's higher low we had several strong stocks that we were watching.
Notice how the price action of these stocks differ from the weak stocks above.
The first stock on our LONG list was Research in Motion (RIMM)…
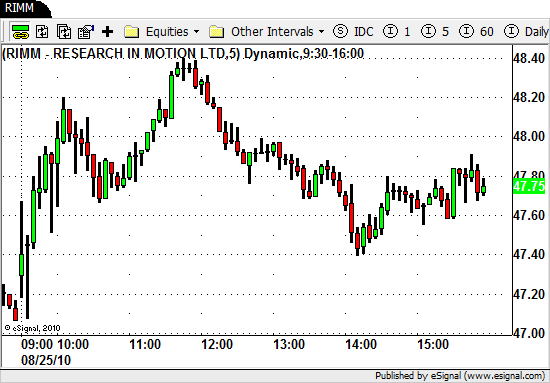
Notice first how RIMM GAPS UP on the open as the overall market is GAPPING DOWN.
Also unlike the overall market RIMM heads straight up until the 10am number while the market is headed straight down.
A good sign of strength wouldn't you say?
At 10:40am as the market is confirming its higher low RIMM has retraced off of the high and is now set to possibly head to higher highs.
RIMM gave us a nice setup on the 10:55am bar as the market took out the 10am high and started to head up.
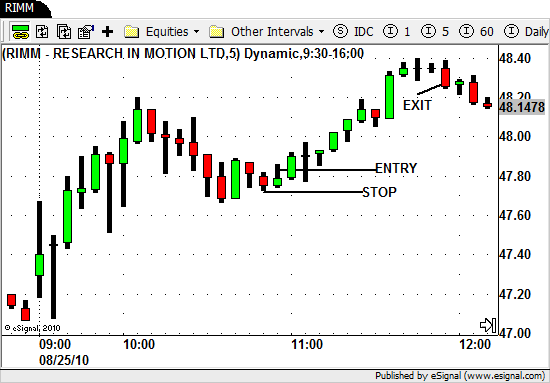
Our INITIAL STOP LOSS was placed .02 below the LOW of the 10:50am at $47.70
Our ENTRY PRICE was .02 above the HIGH of the same bar at $47.84 for an initial risk of .14/share.
We were able to EXIT our trade at $48.24 (2.85/1 R/r) as the overall market and RIMM began to retrace.
This is another classic example of day trading the INTRADAY PRICE SWINGS in the market!
And for our last example let's take a look at the chart of Harman Intl (HAR)…
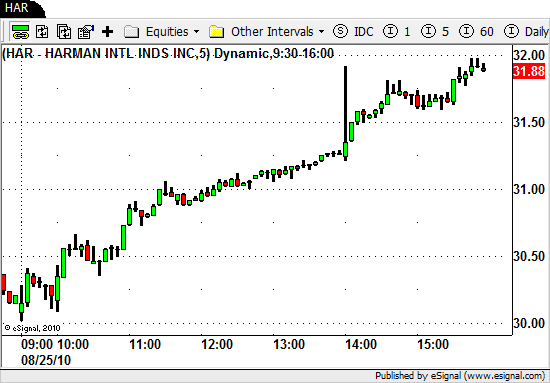
Notice the relative strength in HAR this morning as it never traded to new daily lows as the market rolled over on BAR 3 this morning.
The first LONG opportunity in HAR came during the bar at 10am.
As the market began to retrace at 10am HAR created a bullish engulfing bar and traded to a NEW HIGH for the day.
If a stock moves to NEW HIGHS for the day prior to the market doing so it is a sure sign of strength and a stock to watch if the market continues to push higher.
The second opportunity to get LONG in HAR was the 10:40am – 10:55am bars on the chart.
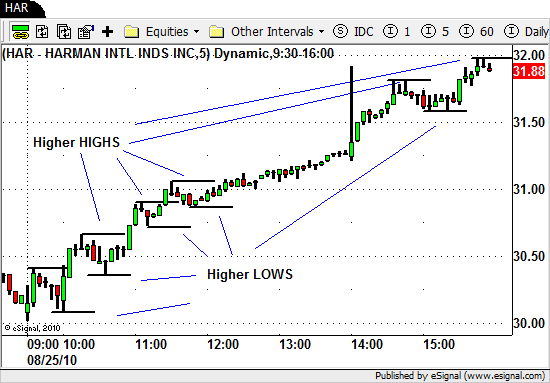
This chart clearly defines an intraday UP trending stock.
Relative strength right from the open and then a series of price swings that create HIGHER HIGHS and HIGHER LOWS.
Here is the chart with the Swing Highs and Swing Lows marked.
When the market cooperates strong trending stocks like this often give you additional trade setups when the afternoon session rolls around.
The breakout at 2pm and getting LONG just after the 3pm pullback were two more opportunities to profit in this stock.
The afternoon also offered up several more LONG trade setups for us as the market headed to new highs.
Some of the other stocks we traded after 2pm were CREE, LNC, WMT, ANF, AKAM, CLF and WYN.
We hope this post provides you with some insight of how we "Swing Trade" on an INTRADAY price chart.
If you have any questions or feedback please leave us a comment below and as always…Good Trading to YOU!
Tags: Day Trading, Day Trading Chart Patterns, Day Trading Price Action, Day Trading Strategies, Intraday Swing Trading


[…] Intraday Swing Trading Strategies – Day Trading the Price Swings | Swing Trading Boot Camp […]
Twitter Trackbacks…
…