Can you say Volatility?
Wow!
What a roller coaster ride we had in the market this week!
After the dust settled we ended the week with the NASDAQ down 8%, the S&P down 6% and the DOW down 5.7%.
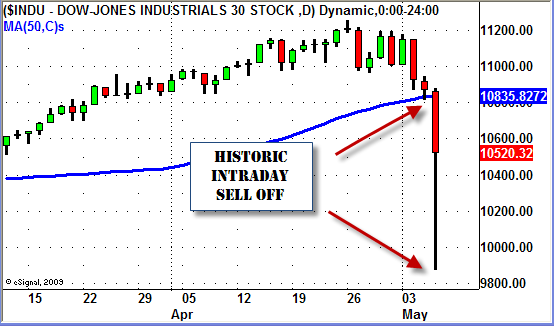
This highlight of the week was of course the historic intraday sell off in the markets on Thursday.
The DOW fell almost 1,000 points (due to a trading error?) in the early afternoon but staged a comeback and the late day rally brought the market up to finish the day down only 347 points!

Wow…what a crazy day indeed!
Last week we advised our Swing Trading newsletter subscribers to go into this week on "High Alert".
This alert was due to the market putting in its first significant LOWER HIGH since the rally started in February.
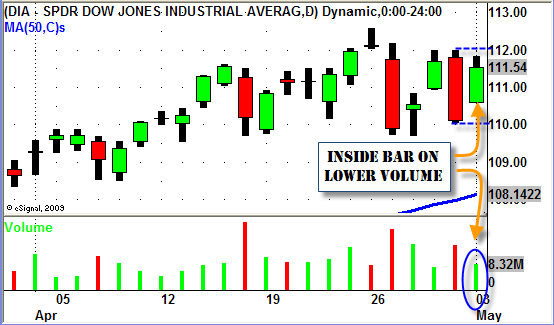
He is a a similar chart that we posted with our "alert".

The S&P and NASDAQ 100 charts had the same chart pattern which was a "triple heads up".
When the market opened up on Monday and rallied right out of the gate finishing just off the highs a lot of traders thought Fridays price action had to be a "fake out".
For us though Tuesday's price AND volume action kept us looking more to the SHORT side for Swing Trading opportunities.
When we have a strong move (like the DOWN move on Friday) followed by a LOW VOLUME "inside day" it is only an indication that price is "stalling".

When price "stalls" we simply wait for the market to tell us what it will do next.
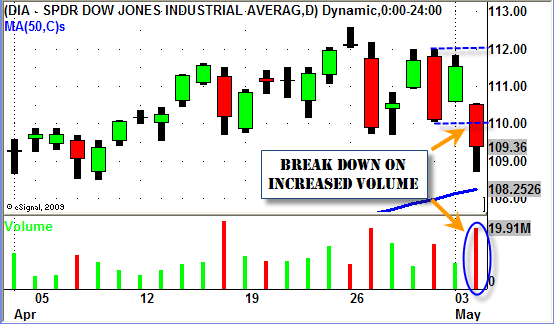
Then on Wednesday the market spoke LOUD and CLEAR and confirmed that the dominant direction was to the DOWN side by gapping down and selling off on INCREASING VOLUME.

Going into Wednesday there were several stocks and ETF's that had nice SHORT Swing Trading setups.
Or for those of you who don't feel comfortable SHORTING yet we recommend you focus on the Inverse ETF's.
DXD, SKF, FAZ, and DUG (just to name a few) all had nice LONG setups since they are Inverse ETF's.
If you were SHORT (or LONG the Inverse ETF's) going into Thursday everything was good to go until the excitement started in the afternoon.
Then things got a little tricky.
If you use intraday data in your swing trading the extreme volatility Thursday afternoon gave you a chance to lock in some nice profits.
If you are able to only use end of day data then the situation was obviously a little different for you.
We use intraday data so we did a complete post on how we handled yesterday's extreme volatility HERE.
We exited most of our positions yesterday as our trailing stops were hit when the market rebounded after the massive sell off.
If you werent prepared or didnt have a plan then you probably gave back some profits.
We had no problem being almost flat even if the market would have continued significantly lower today. (the DOW was down today but still higher than the LOW of yesterday).
We followed our trading plan and exited our positions when our rules told us to.
Today (Friday) was simply a day for us to watch the market to see how things would finish for the week.
We aren't looking to chase this market down at this point.
We will sit on the sidelines and patiently wait for our next LOW RISK/HIGH REWARD trade setups to present themselves.
A few sector ETF's we will keep a close eye on as we move forward are the SILVER (SLV), GOLD (GLD) and the GOLD MINERS (GDX) ETF's.
After such a crazy week in the market don't get over anxious and start trading just to trade.
It can be tough when the market is moving the way it did this week.
It creates "excitement" and sometimes you may feel like you are "missing the boat".
BE PATIENT!
There will be plenty of opportunity in the very near future for you to get back into the market no matter which way it goes from here.
Until next week…
BE PATIENT, PROTECT YOUR CAPITAL and GOOD TRADING TO YOU!
Tags: Dow Jones Sell Off, ETF Swing Trading, Inverse ETF, SHORT SWING TRADING, Swing Trading Blog, Swing Trading Chart Patterns


[…] Blog « Swing Trading Week in Review – May 7, 2010 […]