
Swing Trading Update 06.21.19
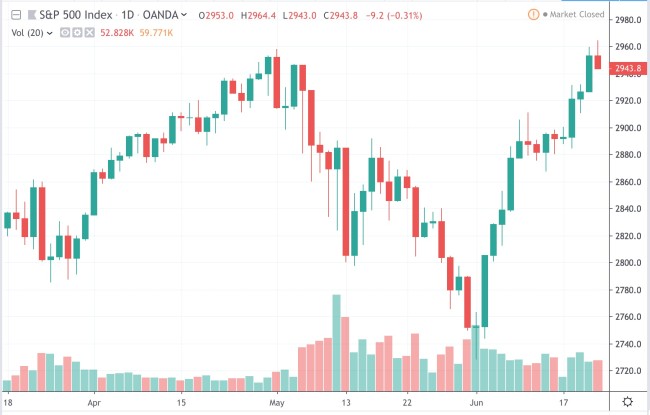
S&P 500 ($SPY)
|
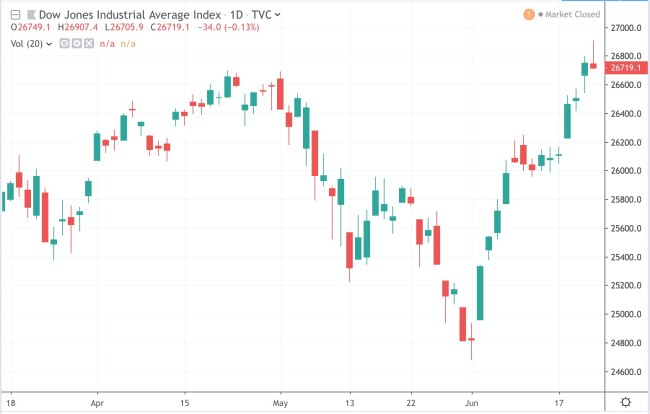
DJIA ($DIA)
|
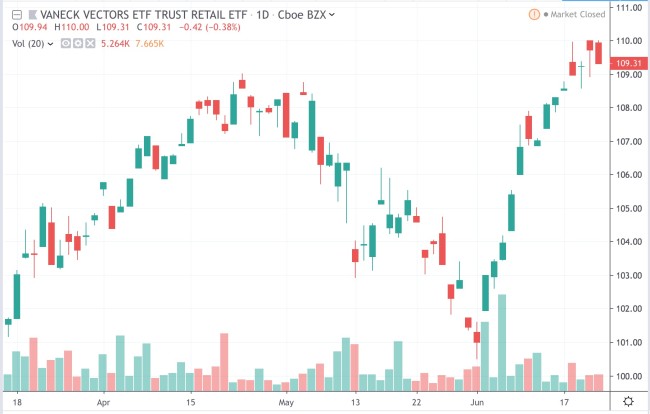
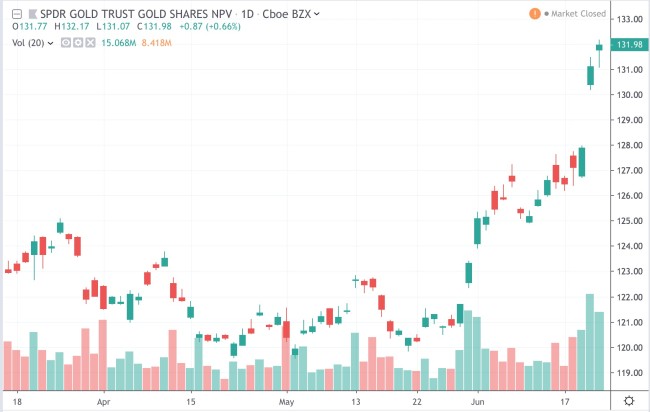
SECTOR WATCH – $GLD $RTH
|
SUMMARY
|
|
|
|
|
Well it was definitely an interesting week to trade the markets this week!
The intraday price action was great, both on the long and short side, but it was a little different for the overnight traders.
After a pullback that started at the end of last week we watched the market move bit higher on Tuesday and Wednesday.
This move up got a lot of traders LONG again…but what a difference a day makes.
The sellers came out in force on Thursday and again on Friday.
This "breakdown" created a lower high in the $DIA and $SPY and both indicies then pushed lower towards their 50 day MA's.
Take a look at the video to see a review of the stocks and ETF's we were watching and trading this week.
ETF's mentioned in the video:
$DIA $SPY $RTH $XLE $OIL $SMH $XHB $XLV $GDX $SLV $XHB $XLF $SLV
Stocks mentioned:
$G $BA $CAT $ABX $SLW $M $ANF $PCAR
Swing Trading BLOG – Swing Trading BOOT CAMP
Well 2013 started with a BANG now didn't it?

This holiday shortened week started out with a rally on BIG VOLUME on Monday.
The price action we saw created a bullish engulfing bar on the charts. This type of chart pattern was a sign for the shorts to cover as the longs pilled in!
Once the news of the fiscal cliff deal came out the marked GAPPED UP in a big way on Wednesday after being closed Tuesday.
This GAP UP left a lot of traders scratching there heads on where they could enter into the move.
As a SHORT TERM trader the day to get long was on Monday…not on Wednesday.
The move that happened Wednesday classifies as a continuation move for us.
We were looking to SELL our SHORT TERM trades towards the end of the week…not enter into new positions.
As you look through the charts you will see nearly the same chart pattern on each one of them.
The sector ETF's look the same although some were better candidates then others.
The Financials ($XLF $IYF) and Homebuilders ($XHB) had some nice setups.
The Steel ETF ($SLX) also had a nice pattern to trade if you caught it in time.
As far as individual stocks go there are too many to list. Lets just say that there were tons of good looking charts out there to trade. ($GOOG, $NSC, $GS, $MA, $V, etc)

Next week will be the true test to see how real this rally is.
Keep you eyes on stocks that start to pullback to see how the hold up in relation to the overall market.
If the rally continues there will be plenty of time for more good trades.
There is no need to chase the market up.
As always have a plan and prepare for whatever the market throws your way.
Until next week…Good Trading to YOU!
Intraday Swing Trading Strategies – The "3Down" Chart Pattern
This morning we were on the watch (as always) for one of our favorite chart patterns…the "3Down".
We had a few stocks on our list this morning but one stock that stood out like a sore thumb was $MON.
$MON was showing unusual relative strength this morning as the overall market tried to find its way.
Both the DJIA and S&P both sold off early and hit NEW LOWS on the third 5 minute bar of trading today.
Here is the chart of $DIA…

And now take a look at $MON for comparison…

The strength is obvious.
So now that we know we have a strong stock in a relatively weak market what do we do?
We watch and wait.
As the $DIA finds a bottom and start to retrace $MON starts to pullback.
We know at this point that the chances are high that the strength in $MON will not continue if the market starts to push lower again.
If however the overall market transitions from weak to strong then $MON could make its next move higher.
The 10:15am bar is where all the action took place for this trade.
Here is the setup and the countdown chart for the "3Down"…

Notice the first attempt to begin our countdown on the chart above.
The bar before the "XX" on the chart is the first "1" bar.
The next bars high is higher than the previous bar so we start over.
The bar after the "XX" starts our new count over at "1" since its higher is lower and its low is also lower than the previous bar.
The next 2 bars do exactly the same thing giving us our "3Down" setup!
Notice also how bar "3" has lower volume than bar "2". This means the selling is drying up.
Now that we have a valid "setup" we wait to see if we get an entry signal.
The 10:15am bar (marked with the BLUE arrow) provides us with a text book entry.
The volume starts pouring into this bar early so we can figure the price action will move one way or the other.
This bars low never trades below the low of the previous bar…bullish!
This bar trades above the high of the previous bar…bullish!
As the bar develops BUYING volume increases…bullish!
We are in the trade at $90.27 (.02 above the previous bars high) and we set our stop at $90.12 (.01 below the previous bars low) for an initial risk of .15/share.
Our STS profit target is at 2x the initial risk (2 x .15 = .30) so we set it at $90.57 ( $90.27 + .30 = $90.57).
Three bars after our entry $MON hits $90.57 (trades up to $90.61) and hits our target before beginning another pullback.
© Swing Trading Boot Camp 2024