Posts Tagged ‘Trading Volume’

Swing Trading Week in Review – July 23, 2010

Saturday, July 24th, 2010
DIA - Swing Trading ETF

Wow! What a difference a week makes!

After last Friday's sell off every talking head in the media was predicting "doom and gloom" and DOW 8000.

When the market closed today you heard nothing but what a GREAT market this is and how we could be headed for new highs!

I have long ago dismissed most of what is said on CNBC, Bloomberg, etc. and watch and listen now solely for entertainment purposes.

As a trader I think it can be very misleading and can often times cloud your decision making process.

Do your own research and follow the rules of the system you put in place based on the result of your research.

I say this because a few traders that I talked to this week said that they were not even looking to the LONG side of the market because "everyone I hear on TV is bearish on the market".

As a short term trader you need to be in sync with market.

By being "in sync" with the market often times you can profit from short term price swings regardless of the overall market environment.

Being prepared for whatever the market does is half the battle.

During our "Swing Trading Weekly Wrap Up" webinar last night there was one question that came up a few times.

A few people asked how we were able identify any LONG trades this week since the overall market was in such a obvious DOWN trend.

These traders, like the ones mentioned above, were also only focused on the SHORT side of the market and essentially missed the move up in the market this week.

Part of our answer to this question is that we ALWAYS have a list of STRONG and WEAK stocks and ETF's on our watchlist.

During the past few weeks we have been mostly focused on the WEAK stocks since we were in a down trending environment.

At the same time though we maintained a list of stocks and ETF's that were showing relative strength to the overall market.

When the market gives us "clues" that it may be transitioning from one mode to the other (in this case from DOWN to UP) we are turn to this list to look for trading opportunities.

For beginning swing traders we always recommend that you trade on the same side of the 50 period SMA as the overall market.

We use this as a "dynamic" trend line to keep new traders on the right side of the market.

So, for example, if the market is trading below the 50 period SMA look for trade setups in stocks and ETF's that are also trading below the 50 period SMA.

When the overall market is trading near the 50 period SMA looking for trade setups on BOTH sides of the market is often times a good idea.

That way when the market gives you confirmation on which way it is headed you can on the right side if the market and take the appropriate trades.

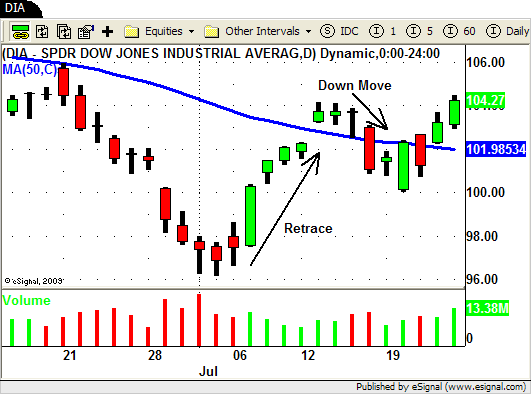
This week we saw this exact setup in the market.
DIA - Swing Trading ETF

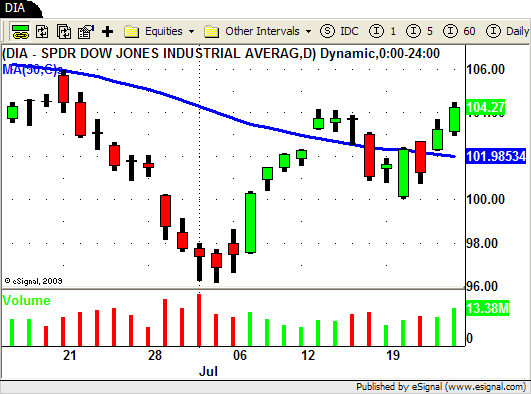
After hitting new yearly lows at the beginning of the month the market put in a decent retrace until July 14th.

The next move DOWN started on the 15th and was followed by a "high volume' sell off last Friday.

During this time most of our SHORT trades (ALL, MET, ZION, LNC, etc.) worked out very well and we were able to take profits in our positions.

Some of our other SHORT positions (SLX, CLF) we a little slower to move to the down side.

Since we are SHORT we need to see a few things to let us know that the trend is still down and going lower.

We need to see price action moving lower and volume moving higher.

This lets us know that sellers are jumping back on board to move prices lower.

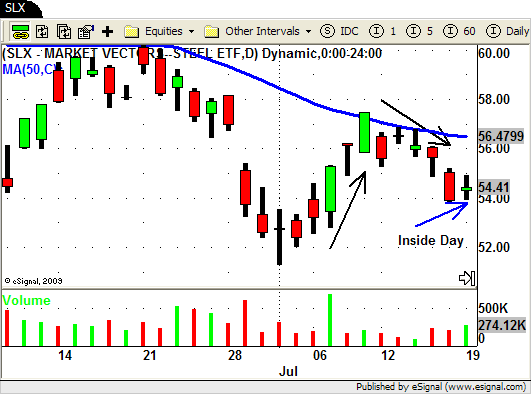
Monday the price action in the overall market and in some of our positions was less than impressive.

Volume was significantly less than Friday as well.

Not exactly the follow through you would expect after such a big sell off on Friday.

Our slow moving SLX SHORT actually creates a low volume "inside day"…a classic price stall.
SLX - Swing Trading ETF

We failed to get what we need to confirm we are still headed lower.

This "stalling" price action gives us our first "clue" and puts us on "high alert" that sentiment MAY change.

These "stalls" dont give us an exit signal from our SHORT positions just yet.

We still need confirming price action (and volume) to take action.

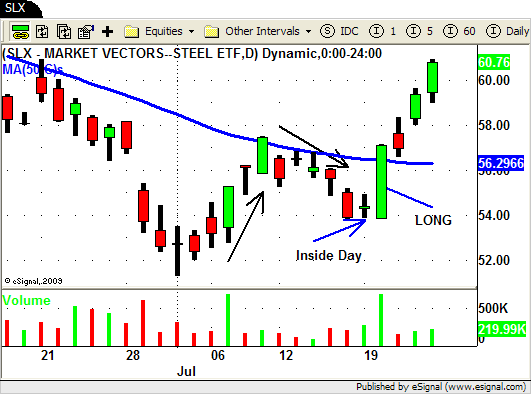
Tuesday's "gap and go" was CLEAR sign that SHORT was the wrong side on the market.

We were able to cover our SHORT in SLX for a tiny profit and our CLF SHORT at break even.

We not only covered our SHORT trade in SLX we actually flipped to the LONG side based on the context of the market and the sector itself.
SLX - Swing Trading ETF

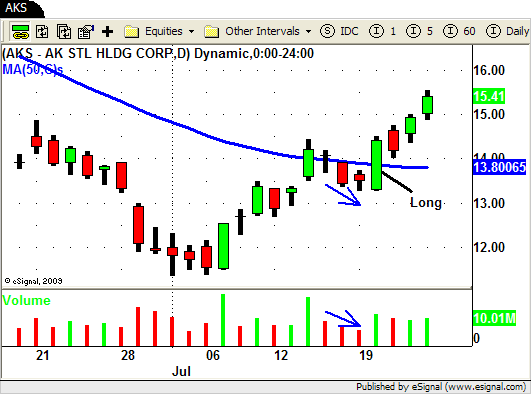
We did NOT flip to LONG in CLF but we did buy AKS since it had a stronger chart pattern.

Notice the LOW volume 3 day pullback prior to AKS ripping higher.
AKS - Swing Trade

Both SLX and AKS were trading at their 50 day SMA's and Tuesday UP move created a DOWN trend break out in both as they traded and closed above their 50 day SMA.

These were both "trend transition" type trades and may have been a little difficult for some traders to identify.

There were however plenty of STRONG stocks (trading ABOVE their 50 day SMA) to turn to once the market started its UP move.

Several chip stocks (ALTR, XLXN, MCHP, LLTC) were showing tremendous relative strength lately and offered up some nice trade setups.

Plenty of other stocks presented the same opportunity – HAL, ALK, CRM, AKAM, HMIN, NTAP, AXP, JNPR, and ATVI just to name a few.

Pull up the charts so you can see how these "strong" stocks reacted when the market pushed to the UP side.

Be prepared for anything and everything!

If you want to know exactly how we find the best Swing Trading Setups please join us at our upcoming webinar this Friday night!

You can register HERE!

Until next week…Good Trading to YOU!
Swing Trading Chart Patterns – Double Top

Wednesday, June 23rd, 2010

Swing Trading Blog Post – "Double Top" Chart Pattern

Last week, in the midst of the 9 day "mini" rally, we notified our Swing Trading Newsletter subscribers of several stocks and ETF's that were forming interesting chart patterns.

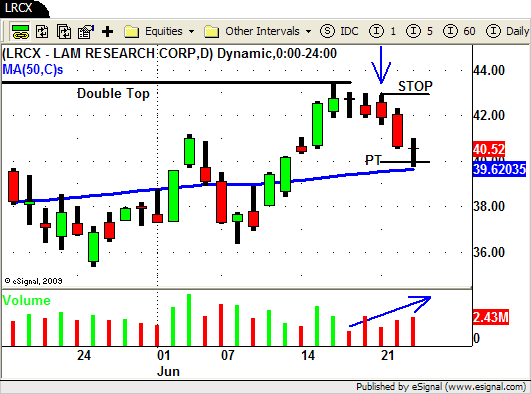
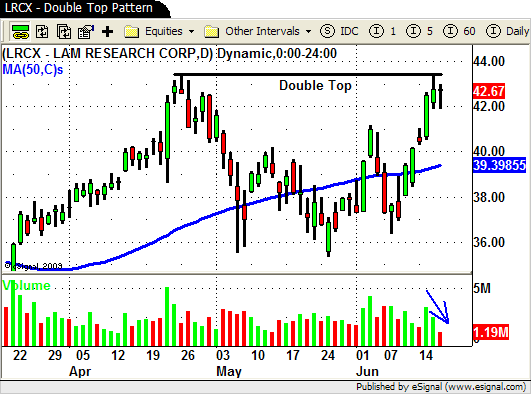
As the market became short term "over bought" we noticed LRCX approaching at level that it reached in late April.

Here you can see the chart that we posted to our subscribers (and the hint we gave on Twitter) last Thursday.

LRCX - Swing Trading Chart Pattern

Thursday was the first day we noticed LRCX "stall" as price action created an "inside day" on decreased volume.

This was just a heads up to our subscribers that a "double top" MAY be forming but to wait for CONFIRMATION before entering into a SHORT position (if their trading strategy called for shorting in this context).

On the chart below you can see that on Friday (the day after our alert) price creates another "inside day" this time on increasing volume.

This type of "stalling" price action is something we would expect near an overhead resistance level but just because price "stalls" it is NOT a signal for us to take action (get LONG or SHORT) just yet.

LRCX - Swing Trading Chart Pattern

When the market GAPPED UP big time on Monday you will notice that LRCX did NOT gap up nearly as much.

LRCX stayed within the prior days range even though the market (and several other sectors) gapped up way above the prior days HIGH.

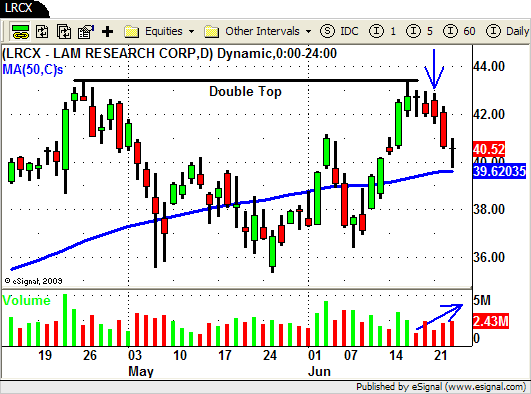
The market quickly rolled over on Monday and by the end of the day LRCX triggered our SHORT entry (BLUE ARROW) as it traded down through Fridays LOW ($41.89), confirming the "double top" pattern.

Just a reminder that since this "counter trend" strategy we consider this an advanced swing trading strategy that should only be taken by experienced swing traders.

That being said we typically use the HIGH on our ENTRY DAY as our initial stop level for this strategy.

Our entry price for the SHORT trade was .02 below Friday's low…$41.87.

The HIGH of our entry day price bar was actually exactly $1 above at $42.87 so we set our actual stop .02 above that at $42.89 giving us an initial risk of $1.02/share.

Using our standard PROFIT TARGET of 2:1 for this type of trade we set our target at $39.85 ($41.87 – $2.02).

Below you can see how the trade turned out.

LRCX - Swing Trading Chart Patterns

Although we like to see confirming VOLUME action when we enter into a trade we always put PRICE ACTION first.

Often times we will see VOLUME follow through the next day (after entry) just as it did here on Tuesday.

This morning LRCX traded down and hit our PROFIT TARGET ($39.85) before turning around and closing the day basically "mid-bar".

Price could continue LOWER from here but this type of strategy ("counter trend") calls for "precise" entries which allow for smaller profit targets.

Being alert to the potential "double top" that was forming we were able into a profitable short term swing trade once we received confirmation that the pattern was in place.


Swing Trading Week in Review – March 19, 2010

Friday, March 19th, 2010

Well after the indices continued to rally and make NEW HIGHS for the year early in the week, the market finally ran into some selling pressure on Friday.

The interesting thing to notice, also on Friday, was the HIGH VOLUME the accompanied the sell off.

A few sectors actually started their sell offs a day earlier.

Last week we posted that we noticed that the Energy, Oil and Semiconductor sectors did NOT participate in the recent rally.

And while the Semiconductors (SMH) actually started to show some strength early in the week both the Energy (XLE) and Oil (OIH) ETF's sold off sharply on Thursday and Friday.

Some of the strongest sectors during this last rally, Retail and Gaming, had mediocre weeks but look good moving forward into next week.

Keep an eye on the Retail stocks, the RTH and gaming stocks like MGM, LVS, and WYNN.

One sector that continues to rally strong is Real Estate.

IYR, and stocks like KIM, DRE, O and SPG, all had a good week and also show some potential new BUY set ups for next week.

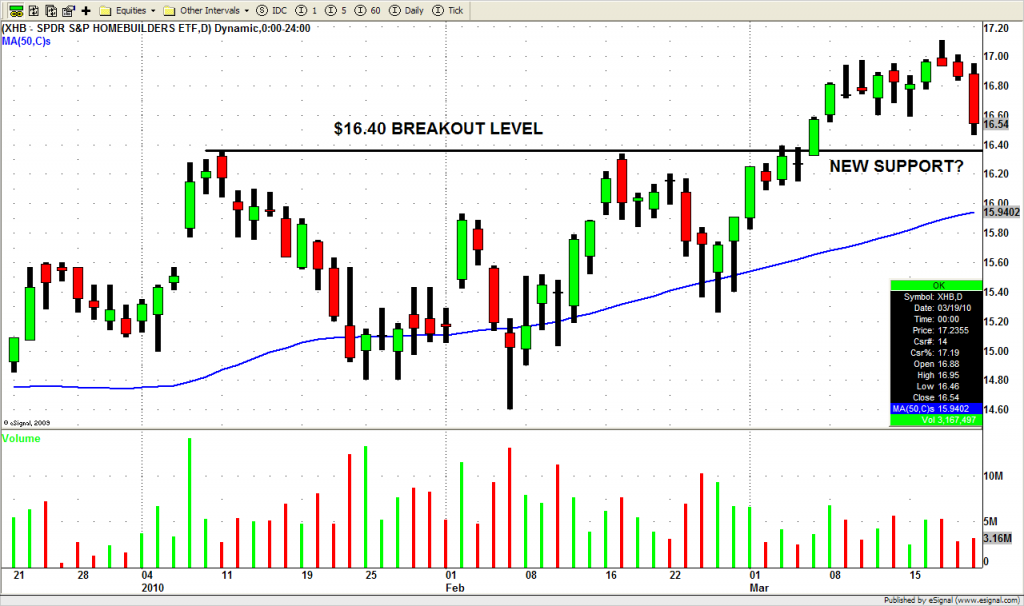
The Homebuilder sector, (XHB), which has also been showing tremendous strength after breaking above the $16.40 level, has an interesting chart going into next week.

XHB Swing Trading ETF

You can see how XHB ran up to just over $17 after it finally broke out above the $16.40 level.

XHB did sell off a bit on Thursday and Friday on relatively light volume.

This is the exact situation you want to see during a pullback AFTER a BREAKOUT!

As XHB pulls back into the BREAKOUT level of $16.40 we will look for this previous RESISTANCE LEVEL to hold as a new SUPPORT LEVEL.

So after Fridays HIGH VOLUME SELL OFF what can we expect next week?

Well it does seem that the market is a bit overdue for a pullback but, as Swing Traders, we need to be prepared for whatever the market decides to do.

Since the market is SO STRONG we will continue to look for LONG Swing trade set ups in STRONG stocks that are trading in the STRONGEST sectors.

Until next week…Good Trading to you!

Swing Trading Week in Review – March 12, 2010

Friday, March 12th, 2010

What a GREAT week for swing traders!

The RALLY continues as the NASDAQ, S&P 500 and several sectors race ahead to NEW HIGHS for the year!

If you listen to some of the talking heads on T.V. you hear that the trading volume for this last up move was very LOW so they remain weary of the the upside potential in the weeks to come.

Now although the "low trading volume" in the broad market MAY be a concern moving forward some of the individual stocks showing great price action and volume patterns for us swing traders!

And despite the DOW's lackluster performance there were stocks all over the place making HUGE upside moves!

Apple (AAPL) closed for the week at its ALL TIME HIGH!

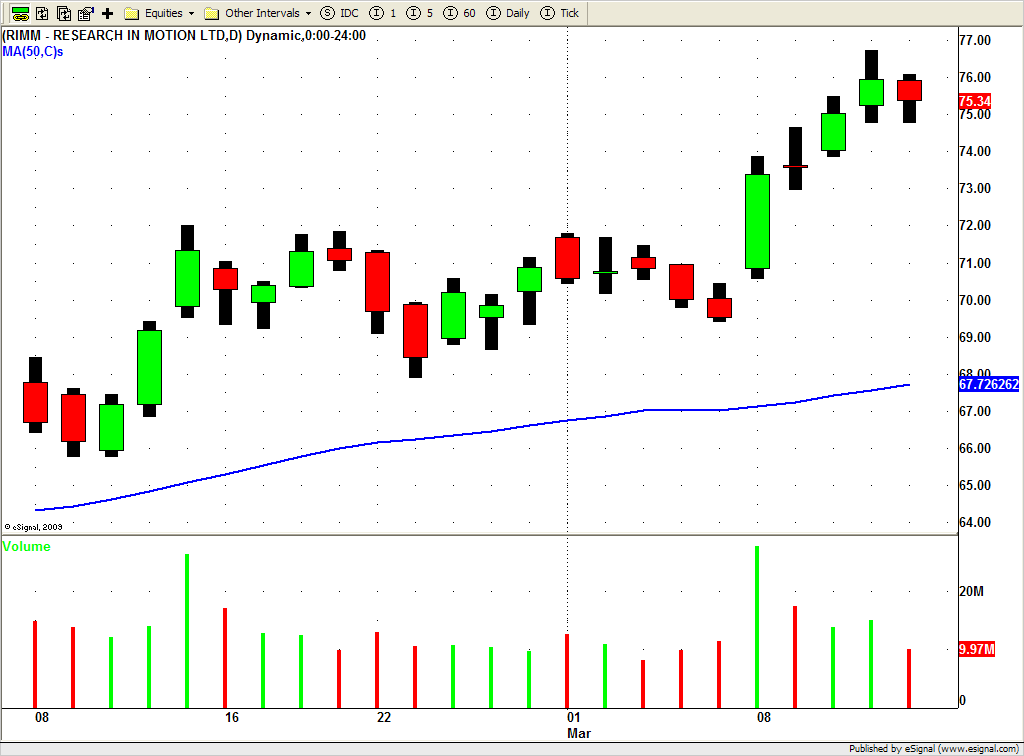
Research in Motion (RIMM) also had a great week, and after breaking through the $72 level it rallied to the upside and closed UP by almost 10% this week!

RIMM

PCAR and LULU we also rock stars this week!

Subscribers to our Swing Trading Newsletters were alerted to numerous BUY set ups this week and a bunch turned out very nicely (if we do say so ourselves)!

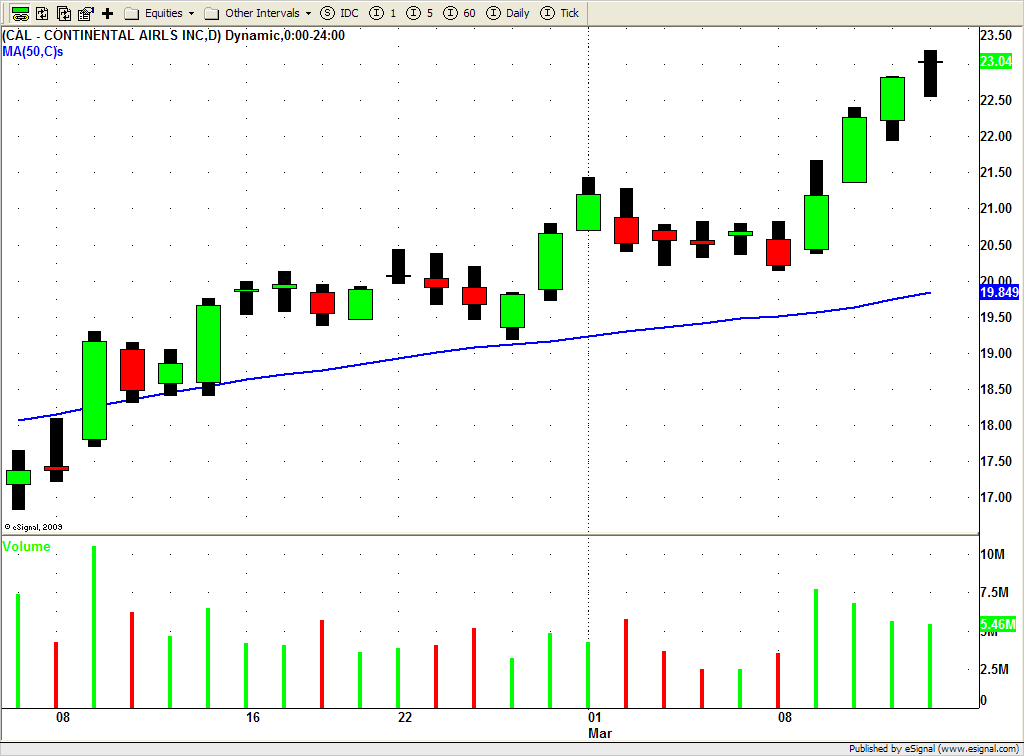
CAL, WYNN, RIMM, and WYN all offered great swing trade opportunities!

CAL Swing Trade

One sector that really took off was the Financial Sector.

Take a look at XLF, IYF, FAS and well as some of the individual names like GS, C, and MET.

The banking sector finished UP 2.5% this week, outpacing the the S&P by more than 2 to 1.

The RETAIL (RTH) and REAL ESTATE ( IYR) sectors also continued their impressive rally with both sectors closing at their highest point of the year as well.

SPG, KIM, O and DRE continued their runs after showing great chart patterns for us last Friday.

Oil (OIH), Energy (XLE) and the semiconductors (SMH) all basically sat this last rally out.

So will these sectors play catch up or will they sell off when the market finally takes a break and pulls back a bit?

Only time will tell but for now we will continue to focus on the sectors and stocks that are showing tremendous relative strength.

Until next week…Good Trading to YOU!


© Swing Trading Boot Camp 2024