Swing Trading Technical Analysis
Will the DOWN TREND in $MOS continue or is a BREAK OUT in the near future?

Let us walk you through our Technical Analysis for this potential swing trade.
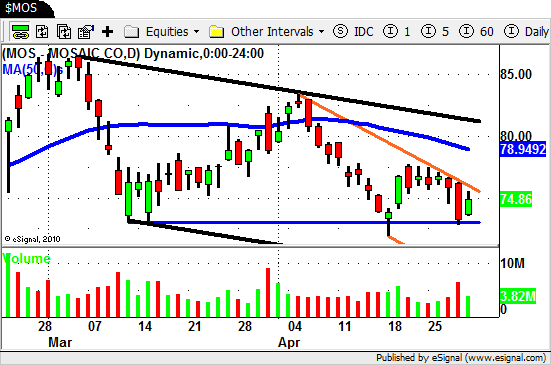
The overall trend is obviously DOWN in $MOS.
The THICK BLACK lines indicate the dominant trend channel.
The horizontal BLUE line is a area of potential support since BUYERS have stepped in each time $MOS has traded down to this level.
The ORANGE lines indicate the short term trend channel that $MOS is currently trading in.
The other stocks in this sector are on the move so we are waiting to see what $MOS does in the days to come.
The push lower on INCREASED VOLUME we saw on Thursday was followed by an "inside day" on lower volume.
We consider this a "stall" and will wait to see how $MOS trades out of this chart pattern.
For the DOWN TREND to continue we would need to see PRICE move lower and VOLUME move higher.
Price would have to break through the previous support area and VOLUME (heavy selling) should accompany that to make it happen.
What would an UP move need to look like for us to take a trade?
A BREAK OUT of the ORANGE CHANNEL on INCREASED VOLUME would be a nice trade set up for us.
This would be an STS trade since there is still some overhead resistance to deal with.
Lets see how $MOS does over the next few days and come back to walk through it together.
We hope you find this Swing Trading Technical Analysis walk through helpful!
