Posts Tagged ‘Swing Trading Price Action’

Swing Trading Chart Patterns – Head and Shoulders

Tuesday, May 4th, 2010

Swing Trading Chart Pattern - Head and Shoulders

With GOLD and the GOLD MINERS ETF's showing recent relative strength we have a few of the stocks, including AEM, on our watch list.

You can see on the chart above how AEM has broken out of an "inverted" Head and shoulders pattern which began to form nearly two months ago.

The overhead resistance was clear in the $61.50 to $62 price level.

So now that AEM has pulled back from its recent high we will look for confirming price action to see if the previous resistance area will now become a new support level.

If the UP move in AEM continues the next possible resistance level would be in the $68.50 area.

Swing Trading Week in Review – April 30, 2010

Saturday, May 1st, 2010

After making NEW YEARLY HIGHS on Monday the market finished down almost 1.8% this week.

Sellers came out in force on Tuesday but the market quickly rebounded Wednesday and Thursday.

The low volume "rebound" came to end on Friday as sellers stepped in again creating a sell off that drove the market down right until the closing bell.

Dow Jones Index 4/30/10

As far as individual sectors go, the Financial ETF's (XLF, IAI, IYF), all made another move lower this week.

We have been watching this sector closely since the negative news came out about Goldman Sachs.

Last week we noticed, and posted to our blog, that the Financial ETF's were not showing much strength as the market made its move up on Thursday and Friday.

The follow through to the down side started on Monday allowing us go LONG the Inverse Financial ETF (FAZ) for a nice short term swing trade.

FAZ - Swing Trading ETF

After hitting resistance at the short term double top FAZ pulled back a bit and continued its UP move on Friday.

Another sector we have been watching closely is the Steel sector.

We began to notice the Steel ETF (SLX) was possibly running out of steam during the market move to new highs on April 14th and 15th.

SLX never made it to new highs as the market rallied and actually begin to sell off as the market made its new high on the 15th.

The weakness continued last week and as the market again rallied to NEW HIGHS by Friday, SLX made an unimpressive bounce off of the 50 Day SMA.

When the sellers stepped in on Tuesday this week SLX sold off right out of the gate and never looked back.

The "Gap Down and Go" as we call it created a "lower high" and was a good opportunity for a SHORT Swing Trade in this sector.

SLX - Swing Trading ETF

So what do we do going into next week?

With the market putting in its first significant "lower high" this week we will continue to look for signs of follow through to the down side.

As always though we will continue to look for opportunities on both the LONG and SHORT side of the market just in case the market finds its legs again and makes a run back towards the highs.

Just remember that being prepared for ANYTHING and EVERYTHING increases your chances of trading success.

Until next week…Good trading to YOU!

Swing Trading Week in Review – March 26, 2010

Friday, March 26th, 2010

Is this the market that never stops?

This is the kind of rally that a lot of traders find very difficult to trade.

"But everything has gone straight up!"… you might say.

Yes and that is the PROBLEM!

When a market rallies like it has, for the last month or so, traders that missed the initial move are STILL WAITING for the market to "take a breather" and pullback so they can get LONG!

To sum it up…THEY HAVE MISSED THE BOAT!

Now I will agree that the rally we have seen is a bit atypical and at times it seems that you would be chasing the market if you entered into any new LONG trades.

I will argue, however, that if you look at the chart patterns and price action of some of the ETF's and individual stocks you will have found plenty of opportunity to BUY strong stocks.

This is one of the main reason we like Swing Trading ETF's and individual stocks.

We can compare their performance against the overall market.

We can determine whether a sector ETF or stock is "STRONG" or "WEAK" in relation to the market.

Our Swing Trading Blog (the one you are reading right now) posts a "Week in Review" every Friday.

Using just the information posted on that blog last week you could have had a great starting point to locate some swing trades this week.

For the last two weeks we posted to the blog that the Oil and Energy ETF's (OIH and XLE) did NOT seem like they wanted to participate in the recent rally (Relative WEAKNESS).

Not the best time to look for SHORT setups since the market is making NEW HIGHS so what about STRONG sectors?

Last week we also posted on the blog that Real Estate, Retail and Gaming have been some of the strongest sectors (Relative STRENGTH) out there.

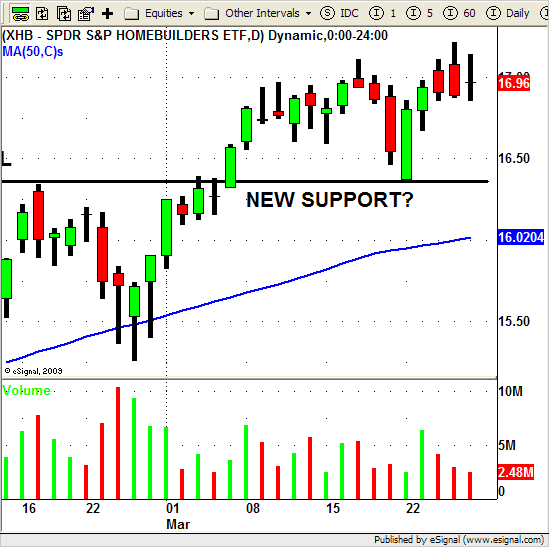
We also posted a Swing Trading chart of XHB, the homebuilders sector ETF, which has also been a very strong sector lately.

We told you we would continue to watch these strong sectors as well as the major stocks in these sectors for swing trading setups.

On Monday morning the market gapped down but never broke through last Fridays low.

Once it held this low you should have been looking to get LONG if the market were to continue its strong rally UP.

This is where a lot of traders "miss the boat".

After Fridays HIGH VOLUME sell off they think that the market has finally started to "pullback" or "retrace".

These traders then start doing their nightly scans for stocks to trade the next day.

The problem is they are looking for SHORT trades and do not even consider looking for stocks to BUY.

Because of this they are NOT prepared when the market proves them wrong (like it did).

Because of this they missed swing trade setups in stocks like WYNN, LVS, MGM, DRE, KIM and O (all from last weeks blog).

And probably also missed the swing trade opportunity when XHB gapped down into support (see charts) and then rallied nicely to NEW HIGHS!

XHB Swing Trading ETF

The next they know the market moves UP strong and they are FLAT (no positions)!

The market moves up again the next day and they don't want to "chase the market " so again they dont do anything but sit and watch.

This is exactly how you miss big moves in the market like we have had over the last month!

Just remember, we never KNOW for certain what the market WILL do!

And like I said last week, as swing traders, we need to be prepared for WHATEVER the market decides to do.

That way once the market decides we, as traders, can simply follow and make the appropriate decisions.

Until next week…do your homework and BE PREPARED FOR ANYTHING!

And as always…Good Trading to YOU!

Swing Trading Week in Review – March 19, 2010

Friday, March 19th, 2010

Well after the indices continued to rally and make NEW HIGHS for the year early in the week, the market finally ran into some selling pressure on Friday.

The interesting thing to notice, also on Friday, was the HIGH VOLUME the accompanied the sell off.

A few sectors actually started their sell offs a day earlier.

Last week we posted that we noticed that the Energy, Oil and Semiconductor sectors did NOT participate in the recent rally.

And while the Semiconductors (SMH) actually started to show some strength early in the week both the Energy (XLE) and Oil (OIH) ETF's sold off sharply on Thursday and Friday.

Some of the strongest sectors during this last rally, Retail and Gaming, had mediocre weeks but look good moving forward into next week.

Keep an eye on the Retail stocks, the RTH and gaming stocks like MGM, LVS, and WYNN.

One sector that continues to rally strong is Real Estate.

IYR, and stocks like KIM, DRE, O and SPG, all had a good week and also show some potential new BUY set ups for next week.

The Homebuilder sector, (XHB), which has also been showing tremendous strength after breaking above the $16.40 level, has an interesting chart going into next week.

XHB Swing Trading ETF

You can see how XHB ran up to just over $17 after it finally broke out above the $16.40 level.

XHB did sell off a bit on Thursday and Friday on relatively light volume.

This is the exact situation you want to see during a pullback AFTER a BREAKOUT!

As XHB pulls back into the BREAKOUT level of $16.40 we will look for this previous RESISTANCE LEVEL to hold as a new SUPPORT LEVEL.

So after Fridays HIGH VOLUME SELL OFF what can we expect next week?

Well it does seem that the market is a bit overdue for a pullback but, as Swing Traders, we need to be prepared for whatever the market decides to do.

Since the market is SO STRONG we will continue to look for LONG Swing trade set ups in STRONG stocks that are trading in the STRONGEST sectors.

Until next week…Good Trading to you!

© Swing Trading Boot Camp 2025