Posts Tagged ‘Swing Trading Blog’

Swing Trading Week in Review – October 5, 2012

Sunday, October 7th, 2012

Swing Trading BLOG – Swing Trading BOOT CAMP
$DIA - Swing Trading ETF

The rally continues (for the most part).

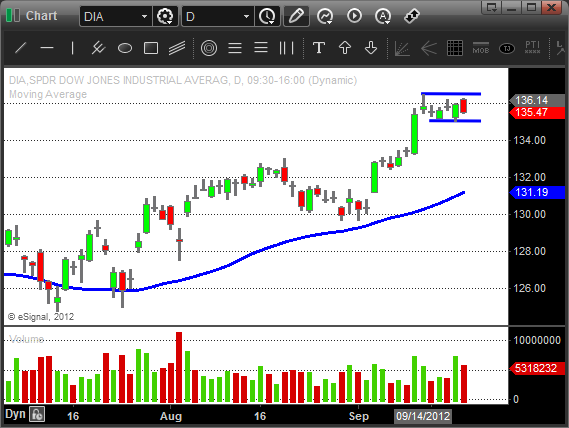
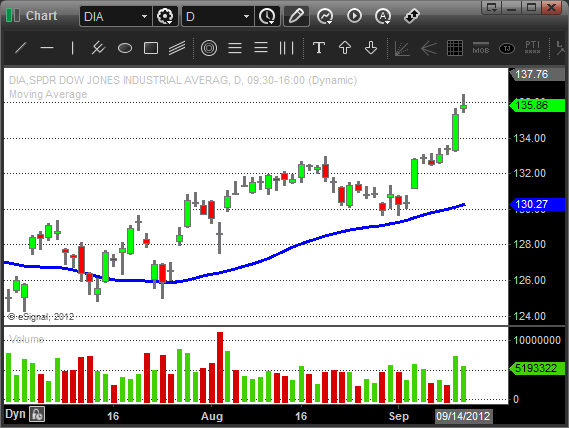
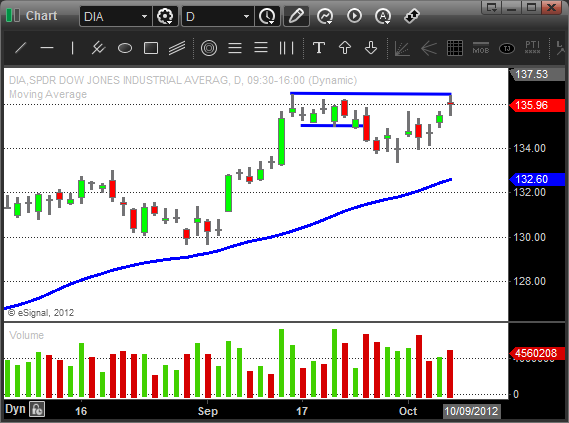
The market drifted higher this week pushing the DJIA back to high that we hit a few weeks back.

This move brings the DJIA into an area that has some traders looking for a double top pattern to take place.

In last weeks BLOG POST we noted the low volume that accompanied some of the moves we saw.

This week the volume did increase BUT it was not across the board.

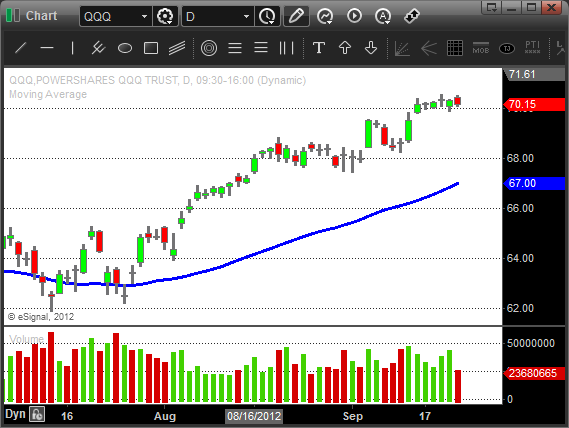
We watched as both the DJIA and S&P rose while the technology heavy NASDAQ basically sat this move out.

The sector action was mixed.

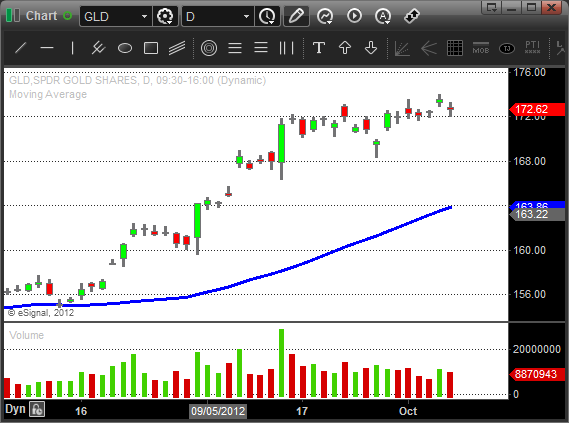
The Gold and Silver ETF's ($GLD $GDX $SLV) continue to hover around their highs.
$GLD - Swing Trading ETF

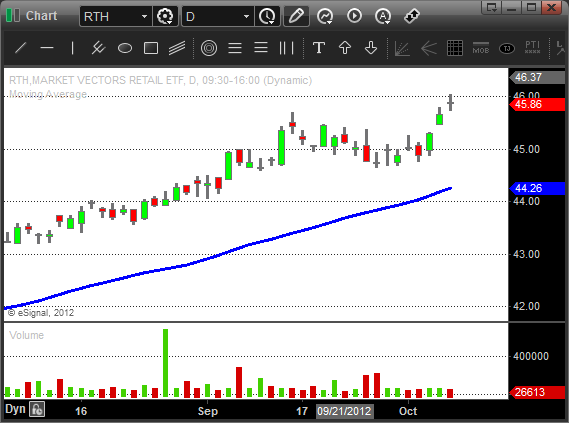
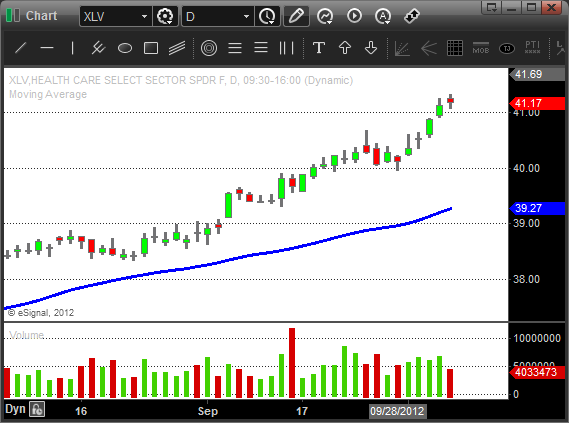
Both Healhcare ($XLV) and Retail ($RTH) broke out to NEW HIGHS.
$XLV - Swing Trading ETF $RTH - Swing Trading ETF

The recently strong Financials ($XLF) and Homebuilders ($XHB) drifted higher as well.

The lagging sectors were Energy and Oil ($XLE $OIH $USO) and the Semiconductors ($SMH) and Tech ($XLK).

This "mixed bag" of results leads us to believe that the market may be losing some steam.

As we move into next week we will need to see confirmation to confirm that though.

If we see the NASDAQ jump on board that could push the overall market higher in a hurry.

If however we see more sectors breaking down or failing to participate then we will start looking to the SHORT side more and more.

As always we will have plan for whatever the market decides to do from here and act accordingly.

We hope you will do the same.

Until next week…Good Trading to YOU!


Swing Trading Week in Review – September 28, 2012

Sunday, September 30th, 2012

Swing Trading BLOG – Swing Trading BOOT CAMP

$DIA - Swing Trading ETF

Swing Traders finally get the pullback that they have been waiting for.

After trading "sideways" last week the market put in a much anticipated retrace this week.

Thursdays UP move was the only decent UP move the market saw this week.

The low volume that accompanied Thursdays price action has us wondering if the next move to the UP side was really upon us.

Take a look through your charts and you will see what we mean.

A lot of stocks and ETF's had moves to the UP side but look at the volume.

You will that many of these moves came on very low volume.

We always like to see price action and volume moving together.

This does not always guarantee that the trades we make when these two are moving together always work out.

More often than not though when the price action and volume patterns work together we get a move in our favor.

Putting the current market action into proper context is very important in most trading situations and this is no different.

After such an extended run up in the market we are always cautious of taking trades after brief pullbacks.

This most recent pullback only gave us 2-3 days of pulling back after breaking out to new highs.

In that case we would like to see a few more days of selling before we jump back in to the market.

It takes experience and honestly a little luck to not jump on every trade in such a strong market.

The traders that did jump back in on Thursday had to wonder if they make the right decision come Friday.

Some stocks and ETF's look like they weathered Fridays action pretty well.

As we look through the charts we see a lot of inside bar patterns.

If you have followed us for any amount of time you know how important these inside bars are in our trading strategies.

The bars are what we consider to be "stalls" in the market.

These "stalls" can give us clues to where the market is headed next.

Continuations out of a "stall" can gives us another chance to enter into a stock or ETF that we may have missed.

If price breaks down after a "stall" then this tells us the short term sentiment has changed.

Some of the sector ETFs with inside bar patterns are $GLD $SLV and $XLK.

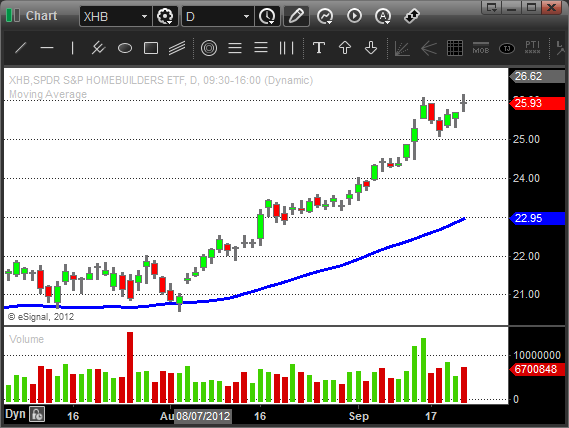
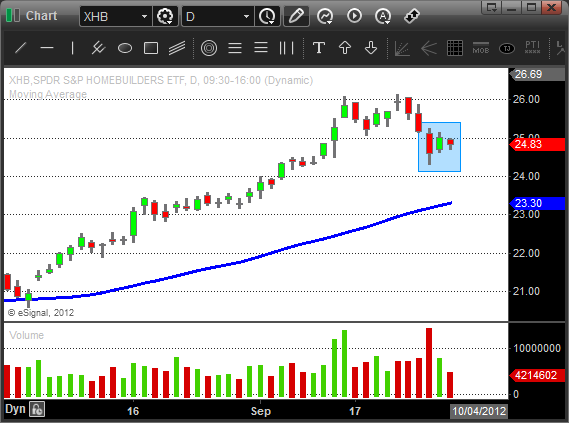
The Homebuilders ETF ($XHB) actually has a double inside bar pattern.

$XHB - Swing Trading ETF

Next week put these on your Watch List if they aren't already and just watch HOW they break out of these patterns.

As we look forward to next week we are still looking mostly to the LONG side.

There are however a few signs that have us looking to the SHORT side…just in case.

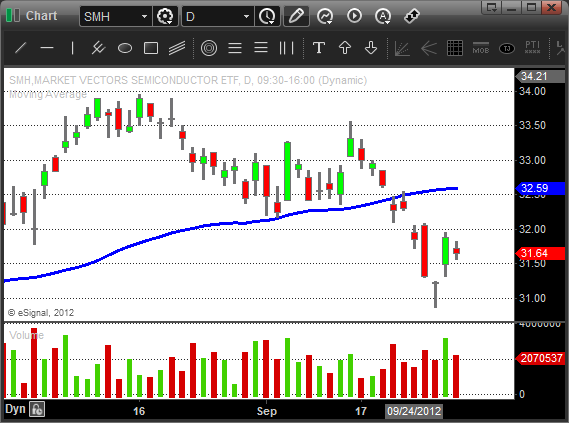
Two sectors that stand out to us are the Steel ($SLX) and the Semiconductors ($SMH).

Both sectors are weak but the semis actually broke down this week.

$SMH - Swing Trading ETF

Being prepared for ANYTHING is crucial to your success as a trader.

Next week we could see the market rip or fall apart.

Have a plan for both outcomes and take action once it happens.

Until next week…Good Trading to YOU!
Swing Trading Week in Review – September 21, 2012

Sunday, September 23rd, 2012

Swing Trading BLOG – Swing Trading BOOT CAMP

$DIA - Swing Trading ETF

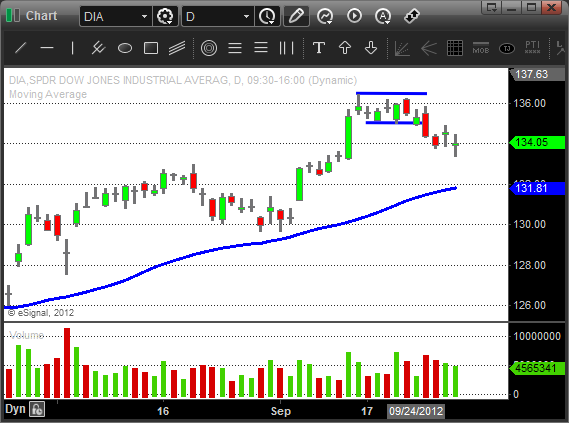
After a nearly two week rally the market finished a "sideways" trading week on Friday.

Swing Traders expected a bit of a pullback after the strong run up but only the S&P has noticed.

The DJIA has barely retraced and the NASDAQ actually made NEW HIGHS mid week before stalling out Thursday and Friday.

$QQQ - Swing Trading ETF

The strength is good of course but as we have talking about moves like this become tricky to trade.

The market will retrace, that is for sure, but when and how much?

No one knows for sure but time will tell.

If the market moves in to new high territory Monday morning are you a buyer?

Should you be?

Understand that if the market takes off out of this sideways price pattern that you are dealing with a different animal.

A move up out this consolidation would be (what we consider) a "continuation" move. 

These type of moves happen once a market has run quite a bit, pauses and then takes off again.

More often than not the second time it takes off the move is short lived.

The move draws in a lot of traders and traps them once the market turns.

Up moves without retraces haven't shaken out the sellers yet.

The buyers are still LONG and not selling yet.

The SHORTS haven't stepped in yet but they are waiting patiently.

Once the move starts to lose steam it usually does it quickly.

The LONGS hit the bid and the SHORTS pile in driving the market lower in a hurry.

When trading these situations you need to adjust your expectations.

Trading a continuation move really deserves its own trading strategy or at least trading rules that take this pattern into account.

As we looked through the charts after the market closed Friday we see a lot of stocks and ETF's that have put in small retraces.

Most of these are also trading above their 50 day SMA's.

The strongest sector ETF's (Homebuilders, Gold, Gold Miners, Silver) are all still at on very near their highs.

$XHB - Swing Trading ETF

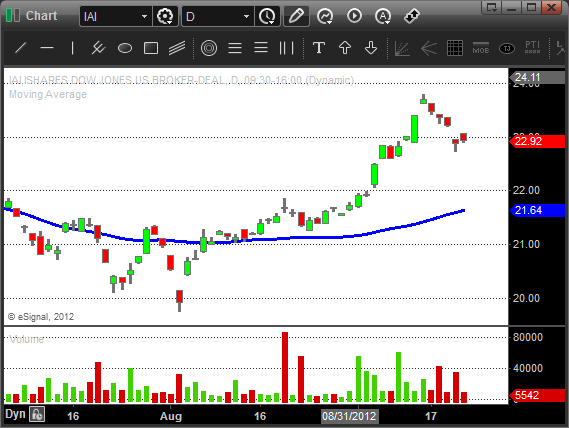
The Financials ($XLF $IAI) and Oil and Energy ETF's have pulled back a bit ($USO got whacked!).

$IAI - Swing Trading ETF

There are lots of individual stocks setting up nicely for some LONG trades.

As we move into next week make sure you update you Watch List and takes your trades as planned.

Understand which phase of the market you are in and look for the clues that the market gives you.

Remember to let your trades come to you and until next week….Good Trading to YOU!

Swing Trading Week in Review – September 14, 2012

Sunday, September 16th, 2012

Swing Trading BLOG – Swing Trading BOOT CAMP

$DIA - Swing Trading ETF

Well in case you haven't heard by now the market continued its BIG BAD RALLY this week.

After consolidating near the highs the market finally broke this the overhead resistance pushing all three indices into NEW HIGH territory.

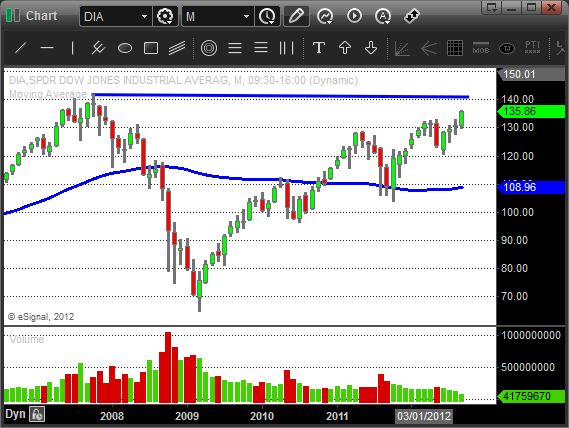
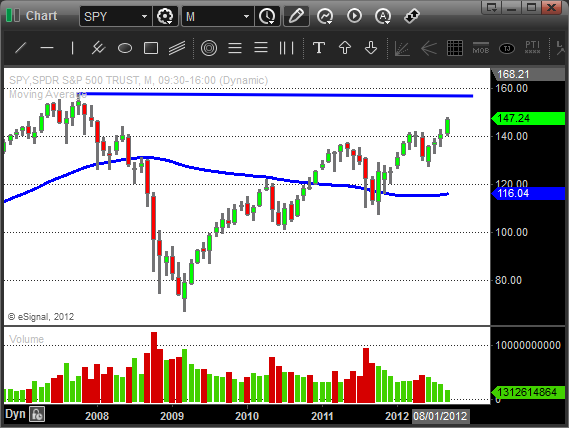
This recent move puts the DJIA and S&P close to the highs prior to the financial crisis.

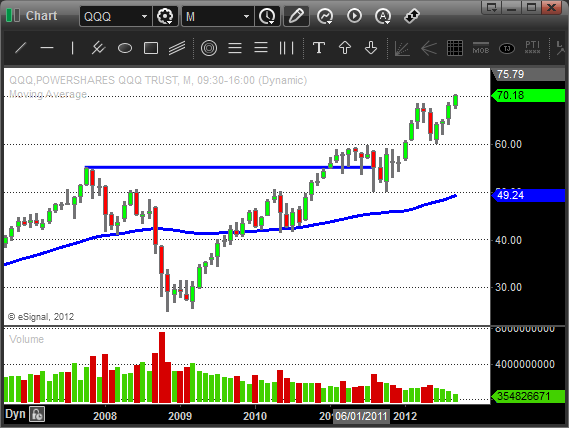
The Nasdaq is trading well above those levels.

Here is a look at the MONTHLY charts…

The DJIA…

$DIA - Swing Trading Charts

The S&P…

$SPY - Swing Trading Charts

And finally the Nasdaq…

$QQQ - Swing Trading Charts

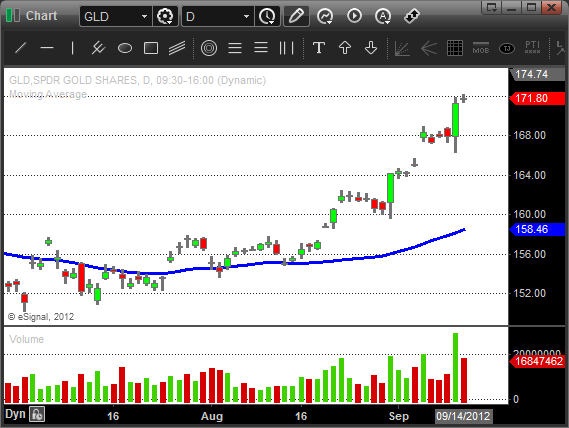
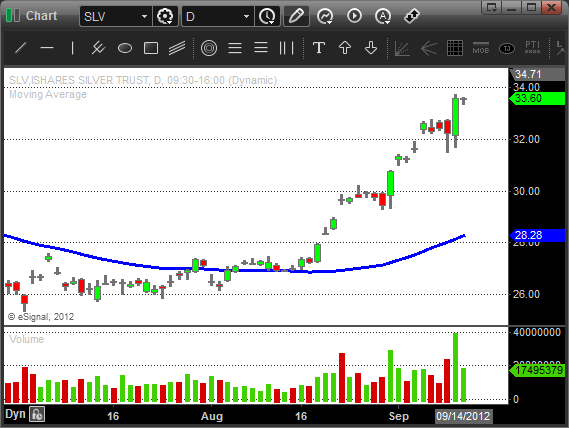
As expected most sector ETF's, including the GOLD and SILVER ETF's, rallied right along with the overall market.

$GLD - Swing Trading Gold ETF $SLV - Swing Trading SIlver ETF

So what does all this BULLISH price action mean for short term traders?

Well for one it means you shouldn't be SHORT!

Since the market is so strong it is actually very hard, in our opinion, to find good short trade setups anyway.

Focus on your LONG list and be aware of the next level in the market.

In this case the next important "level" will be that high established back in 2007.

Day to day price action should remain bullish so pick you spots.

Last weeks post was about NOT chasing the market and letting trades come to you.

As the market becomes stronger it becomes much more tempting to do so.

The last thing you want to do is start buying at price levels where the majority of traders are selling.

Plan your trades and most importantly TRADE YOUR PLAN.

As we look through the charts we see a lot of stocks that have put in some extended moves.

That means that price has moved significantly away from an optimal entry point.

As we move into next week we will be watching the strong stocks and waiting for PULLBACKS.

Once we see these leaders pulling back we will sit and wait and see what price action and volume tells us is coming next.

Until next week…Good Trading to YOU!
© Swing Trading Boot Camp 2024