Posts Tagged ‘Swing Trading Blog’

Intraday Swing Trading with PVT

Tuesday, December 11th, 2012

Intraday swing trading 

As day traders we use the PVT method (price action, volume and trend lines) day in and day out.

Yesterday we saw some great examples of PVT in action.
PVT - Price Action Trading Example

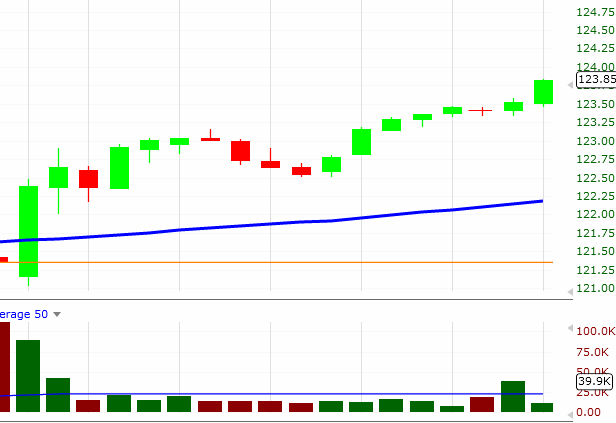
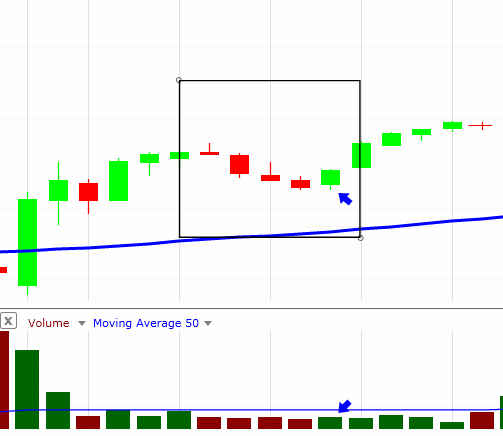
On the chart above you can see a nice up trending stock. Let's focus on the area highlighted in the box on the chart below.
PVT - Price Action Trading Example

In this chart you can see one of the text book set ups of the PVT method.

The stock has already made a NEW HIGH for the day so we now that so far we are dealing with a strong stock.

The box on the chart above shows you the first retrace after the high was made.

We look for these retraces to flush out the sellers. 

Once we know the retrace is in effect we look for the clues that price action and volume give us to let us know if the next move will be higher.

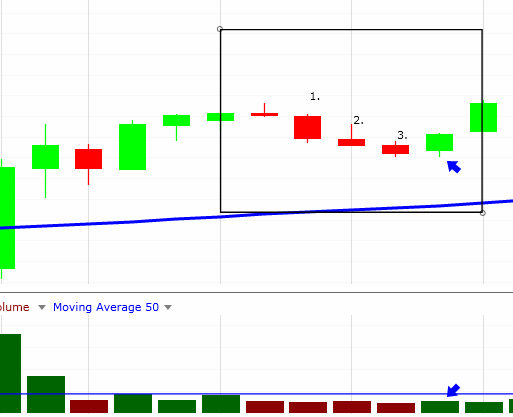
In this example the retrace begins one bar after the daily high was established. We marked this as "1." on the chart below.
PVT - Price Action Trading Example

This bar is followed by 2 more bars (marked 2. and 3.) which gives us our "3Down" chart pattern that we love.

After a "3Down" we watch to see if price action AND volume work together to give us an entry signal.

The next bar after our "3Down" pattern (the blue arrow on the chart) we see the tell tale signs of the next UP move.

We notice that as the bar progresses it never trades below the low of the previous bar…a bullish sign.

We also notice that volume is increasing and as this 5 minute bar comes to an end we KNOW that we have increased volume.

We also see this bar trading higher than the high of the previous bar.

As of this together is a text book entry using the PVT method.

Once the entry is made we simply manage our position and watch as price action/volume continue to tell a story.

 

Swing Trading Week in Review – December 7, 2012

Sunday, December 9th, 2012

Swing Trading Boot Camp – Swing Trading BLOG

$DIA - Swing Trading

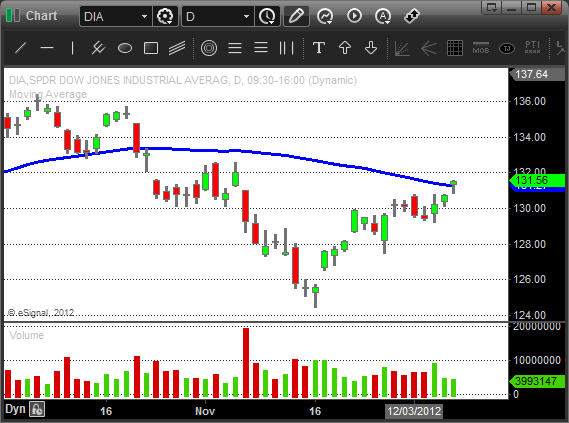
After starting the week on the down side both the DJIA and the S&P turned around on Wednesday.

Both indices finished the week with two days of modest gains.

The NASDAQ lagged behind a bit despite a few bright spots in the tech sector.

This latest move puts some of the sector ETF's back above their 50 day SMA's and has all three major indices trading right at theirs.

For short term traders that focus on price action and volume the move that happened on Wednesday was a good indication that the UP momentum would continue.

The DJIA was the best indicator of things to come.

The early morning sell off quickly turned into a reversal which had the short sellers covering their positions once again by days end.

This day formed a bullish engulfing bar in the DJIA with impressive volume to boot.

Once this continuation pattern was evident it was a good chance to look to the LONG side for some short term trades.

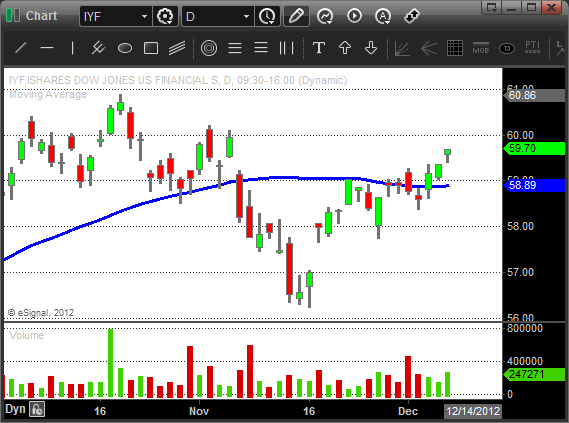
If you trade the ETF's then $XLF, $IYF and $SMH had good chart patterns to trade.

$IYF - Swing Trading ETF

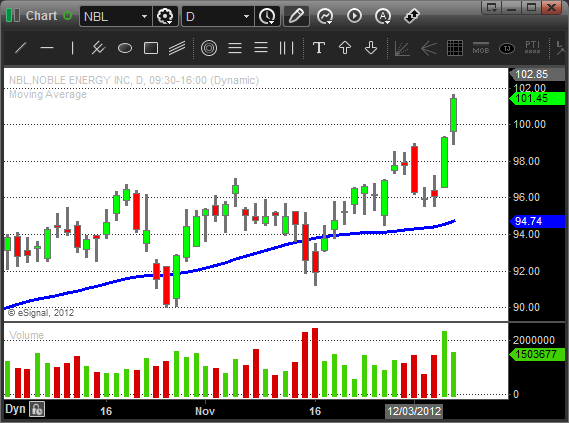
If you were looking for individual stocks then $APC, $$NBL, $ARG, and $VAR were on the radar.

$NBL - Swing Trading Trades

Just remember that we are in SHORT TERM trade mode.

Quick trades…get in and get out. We are not holding our positions with the long term outlook in mind.

We have a lot to consider as we move into trading next week.

There is still significant overhead resistance to contend with.

The NASDAQ is not really participating with much conviction in these UP moves.

Just some food for thought!

Don't try to outguess the market.

Let price and volume tell the story and act accordingly.

Until next week…Good Trading to YOU!

Swing Trading Week in Review – November 30,2012

Sunday, December 2nd, 2012

Swing Trading BOOT CAMP – Swing Trading Blog

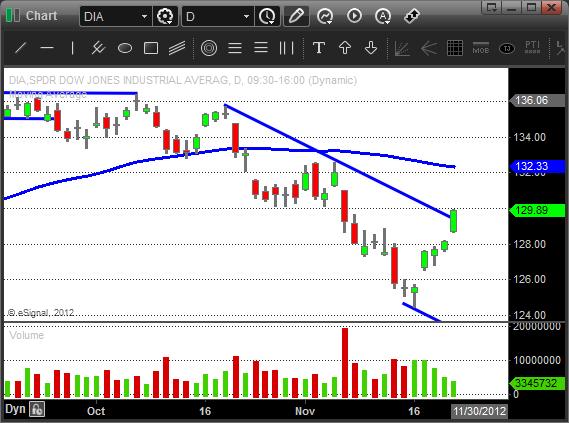
$DIA - Swing Trading Strategies

Not so fast SHORT sellers!

After last weeks "bounce" in the market swing traders were waiting for the next opportunity to present itself to get SHORT once again.

The market showed signs of losing steam with an inside day chart pattern on Monday. Tuesday the trading volume picked up a bit as the market drifted a bit lower.

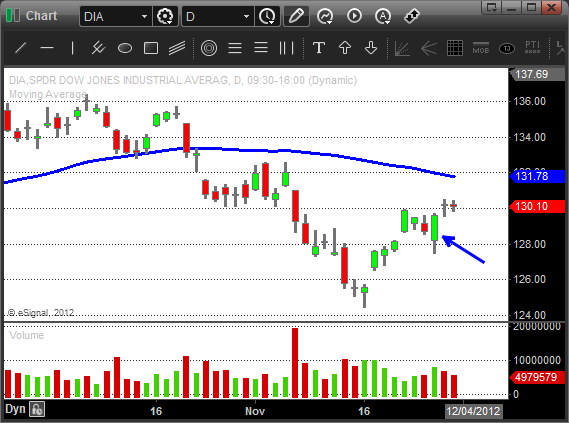
Wednesday (blue arrow on the chart above) was the day the changed the short term sentiment in the market.

That was the day that short term traders got triggers to SHORT once again only to see the market reverse to the upside and close near the high.

This reversal day price action showed that the BUYERS were back in control!

We are still in a DOWN trend but this latest move brings the major indices back up to their 50 day SMAs.

Will the drift higher continue or will the 50 day become the next area of resistance?

Next week we should know the answer.

There are plenty of strong stocks out there that should be on your Watch List.

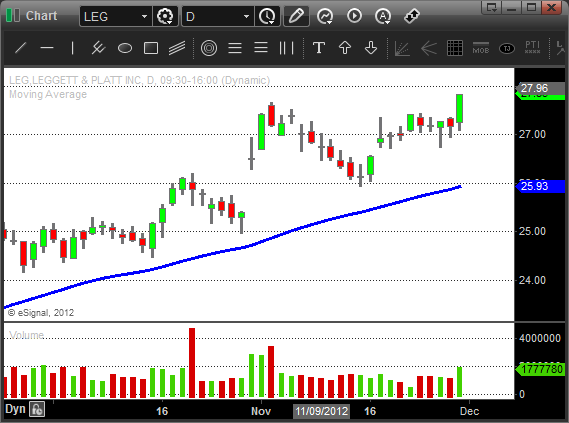
$VMC, $V, $CREE, $FB, $MA and $LEG to name a few.

$LEG - Swing Trading Strategies

On the SHORT side the list is HUGE!

Be prepared for whatever the market throws your way!

Until next week…Good Trading to YOU!

Swing Trading Week in Review – November 23, 2012

Sunday, November 25th, 2012

Swing Trading BLOG – Swing Trading BOOT CAMP

$DIA - Swing Trading ETF

First things first…

Happy Thanksgiving! We hope you and your family enjoyed your holiday!

The markets opened with a bang this holiday shortened week.

Monday traders watched as the market GAPPED UP after weeks of relentless selling pressure.

The move was somewhat expected (as we mentioned in last weeks post) since the market was trading in severely OVERSOLD territory.

All three indices traded basically drifted higher on LOW VOLUME the entire week.

You can argue of course that this low volume is to be expected on a holiday week but we know that it is also a telltale sign of a retrace in down trending market.

The "bounce" was a big one nonetheless.

The Dow Jones Industrial Average rallied over 400 points in fact.

The sellers have taken a break (for now at least) and that is a good thing.

The thing to remember though is that we are still in a text book DOWN TREND.

This latest "bounce" was a retrace on LOW VOLUME.

So what happens from here after such a big bounce?

Who knows.

Some people are calling for the BEAR to lose steam and the BULL to return.

More are saying prepare for a lengthy BEAR market by getting your SHORT strategies ready to launch.

What do we say?

We say…WHO CARES???

As short term traders we need to be ready for whatever the market decides to do regardless of direction.

We are NOT investors.

If the market rallies higher? Great I have a strategy for that.

If the market starts to sell off again? Perfect because I have a strategy for that.

In last weeks BLOG post we gave you the details of our trading plan for this past week.

It played out almost exactly as we described.

Our remaining SHORT positions were stopped out so we were flat going into Tuesday,

The stocks that we mentioned that were showing signs of strength ($K, $V, $CREE, $FB) made some nice moves higher.

Did we jump onto the LONG side?

Not at all. We traded our plan and our plan was to reevaluate after the retrace was confirmed.

The gap up and drift higher scenario would have kept us out of the market anyway.

In hindsight the moves in these stocks would have produced some nice profits.

Our strategy (in this case) was not to buy stocks on a "bounce" in a strong down trend.

We followed our strategy and watched the market for the last 3 days of the week without doing anything expect getting ready for the next move.

Next week we will be watching to see if the down trend shows signs of returning.

If it does we will get SHORT all over again.

If the market shows signs of change (from BEAR to BULL) we will be prepared with a list of LONGS to jump into.

We always try to teach you you be prepared for anything and act accordingly when its time.

This upcoming week is no different!

Until then…Good Trading to YOU!


© Swing Trading Boot Camp 2024