Posts Tagged ‘Swing Trading Blog’

Swing Trading Week in Review – May 28, 2010

Friday, May 28th, 2010

Gap DOWN and roll over, Gap DOWN and RIP, Gap UP and roll over!

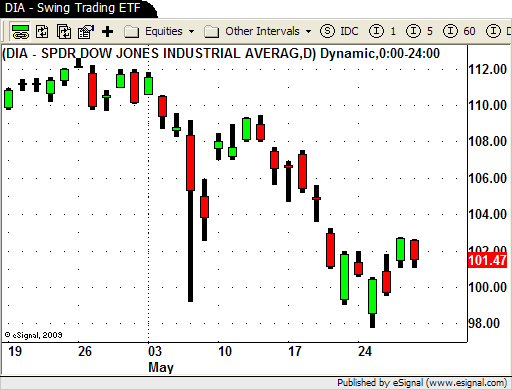
After all is said and done the roller coaster came to a stop and finished down about 60 points for the week.

Not bad considering that we gapped down HUGE on Tuesday and traded down to new yearly lows intraday.
DIA - Swing Trading ETF

All in all the week was a rather boring one for our Basic Swing Trading strategies.

If you were not already short coming into the week it was a little late and difficult to initiate any new SHORT positions.

Most of our basic bread and butter strategies are "with trend" strategies which means that we focus on swing trade setups in the same direction as the overall market and sector.

If the market is in a DOWN trend or DOWN channel these strategies focus on SHORT Swing Trading setups (or LONG Inverse ETF's).

If the market is in an UP trend or UP channel then of course we look for LONG Swing trades.

Some of our more advanced Swing Trading strategies are actually designed as "counter trend" strategies.

These strategies are designed to trade and profit from "bounces", pullbacks and retraces and trade in the opposite direction of the dominant trend.

An example of this would be buying into a LONG position in a DOWN trending stock as it comes into a possible area of support.

The are of course other factors to consider when using "counter trend" strategies and these should strategies should only be used by experienced swing traders.

I mention these advanced strategies because this week we saw a good opportunity to use them.

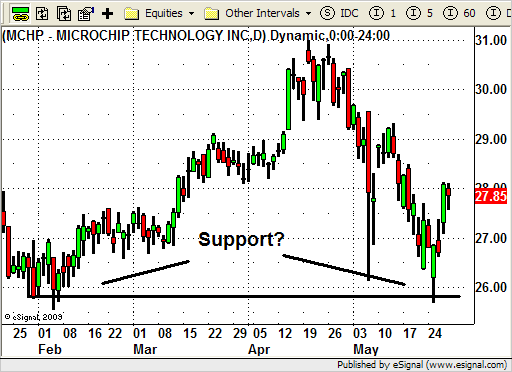
On Tuesday we noticed that the HUGE gap down brought us down to levels in the S&P and Dow that we saw in the beginning of February.

After such as extended move DOWN over the past 2 weeks you had to think that there MAY be some support in the area.

We did NOT blindly buy into the GAP down but instead we waited to see how the market traded around this level.

By mid morning on Tuesday the strength in the market was obvious…there were buyers picking up stock at these new lows.

As the market started to follow through the rest of the day we were able to initiate a few LONG trades.

We looked for relatively strong stocks that were either OVERSOLD or showing signs of holding a support level.

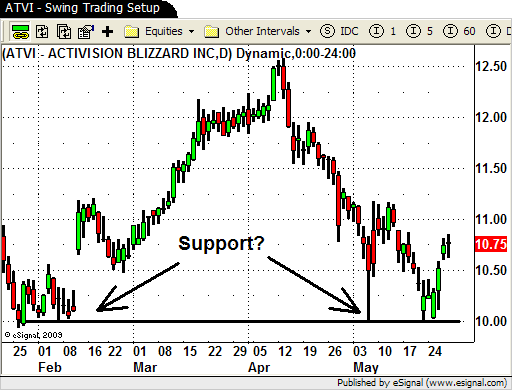
Stocks like ATVI and MCHP.
ATVI - Swing Trading Setup

MCHP - Swing Trading Setup

Both ATVI and MRVL were SHORT TERM OVERSOLD as they traded into their LONGER term support levels.

Tuesday's GAP and RIP gave us any opportunity for a low risk trade in both stocks.

We exited ATVI today (Friday) for a nice gain as it reached SHORT TERM OVER BOUGHT levels into the close.

MRVL was not yet OVER BOUGHT as of the close so we exited a portion of position and are trailing the rest with a tight stop.

We did stay away from some of the other stocks with similar patterns due to their recent weakness.

AXP and X come to mind as well as some of the other financial stocks.

We put these stocks on our "DO NOT TRADE" list because both sectors have been the leaders to the DOWN side in recent weeks.

The recent "bounce" in the market could simply be a pullback before the next down move.

If so we have a bunch of stocks that are setting up nicely to the SHORT side.

If the market finds some legs and continues UP from here we have a few positions on and we will trail our stops accordingly.

We will also look for opportunities to get into some of the strong stocks like FDO, SNDK, ALK and WSM.

No one knows for sure which way we go from here but by being able to trade the market by using some advanced strategies you should be able to make profitable trades in any environment.

Until next week…GOOD TRADING TO YOU!

Swing Trading Week in Review – May 7, 2010

Friday, May 7th, 2010

Can you say Volatility?

Wow!

What a roller coaster ride we had in the market this week!

After the dust settled we ended the week with the NASDAQ down 8%, the S&P down 6% and the DOW down 5.7%.

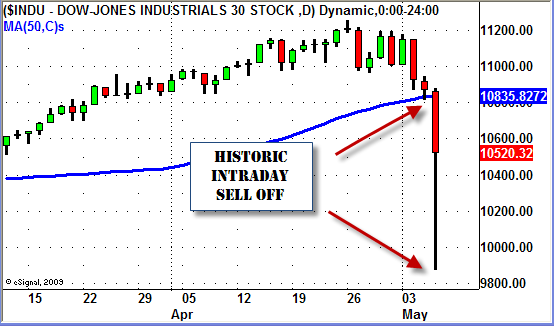
This highlight of the week was of course the historic intraday sell off in the markets on Thursday.

The DOW fell almost 1,000 points (due to a trading error?) in the early afternoon but staged a comeback and the late day rally brought the market up to finish the day down only 347 points!

DOW JONES SELL OFF - May 6, 2010

Wow…what a crazy day indeed!

Last week we advised our Swing Trading newsletter subscribers to go into this week on "High Alert".

This alert was due to the market putting in its first significant LOWER HIGH since the rally started in February.

He is a a similar chart that we posted with our "alert".

Dow Jones Lower High April 30, 2010

The S&P and NASDAQ 100 charts had the same chart pattern which was a "triple heads up".

When the market opened up on Monday and rallied right out of the gate finishing just off the highs a lot of traders thought Fridays price action had to be a "fake out".

For us though Tuesday's price AND volume action kept us looking more to the SHORT side for Swing Trading opportunities.

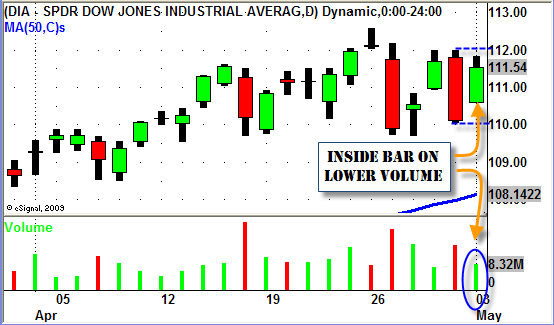
When we have a strong move (like the DOWN move on Friday) followed by a LOW VOLUME "inside day" it is only an indication that price is "stalling".

DOW JONES SWING TRADING INSIDE BAR

When price "stalls" we simply wait for the market to tell us what it will do next.

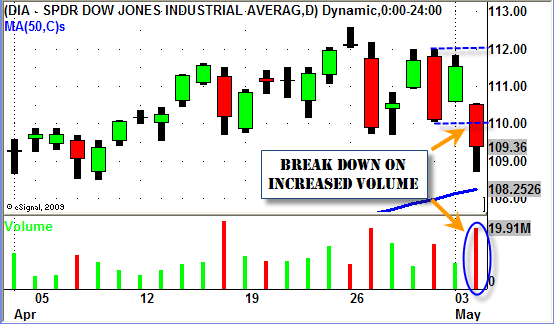
Then on Wednesday the market spoke LOUD and CLEAR and confirmed that the dominant direction was to the DOWN side by gapping down and selling off on INCREASING VOLUME.

DOW JONES - Inside Bar Continuation Pattern

Going into Wednesday there were several stocks and ETF's that had nice SHORT Swing Trading setups.

Or for those of you who don't feel comfortable SHORTING yet we recommend you focus on the Inverse ETF's.

DXD, SKF, FAZ, and DUG (just to name a few) all had nice LONG setups since they are Inverse ETF's.

If you were SHORT (or LONG the Inverse ETF's) going into Thursday everything was good to go until the excitement started in the afternoon.

Then things got a little tricky.

If you use intraday data in your swing trading the extreme volatility Thursday afternoon gave you a chance to lock in some nice profits.

If you are able to only use end of day data then the situation was obviously a little different for you.

We use intraday data so we did a complete post on how we handled yesterday's extreme volatility HERE.

We exited most of our positions yesterday as our trailing stops were hit when the market rebounded after the massive sell off.

If you werent prepared or didnt have a plan then you probably gave back  some profits.

We had no problem being almost flat even if the market would have continued significantly lower today. (the DOW was down today but still higher than the LOW of yesterday).

We followed our trading plan and exited our positions when our rules told us to.

Today (Friday) was simply a day for us to watch the market to see how things would finish for the week.

We aren't looking to chase this market down at this point.

We will sit on the sidelines and patiently wait for our next LOW RISK/HIGH REWARD trade setups to present themselves.

A few sector ETF's we will keep a close eye on as we move forward are the SILVER (SLV), GOLD (GLD) and the GOLD MINERS (GDX) ETF's.

After such a crazy week in the market don't get over anxious and start trading just to trade.

It can be tough when the market is moving the way it did this week.

It creates "excitement" and sometimes you may feel like you are "missing the boat".

BE PATIENT!

There will be plenty of opportunity in the very near future for you to get back into the market no matter which way it goes from here.

Until next week…

BE PATIENT, PROTECT YOUR CAPITAL and GOOD TRADING TO YOU!


Swing Trading Week in Review – April 30, 2010

Saturday, May 1st, 2010

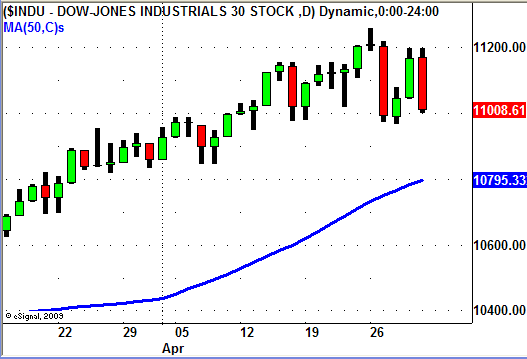
After making NEW YEARLY HIGHS on Monday the market finished down almost 1.8% this week.

Sellers came out in force on Tuesday but the market quickly rebounded Wednesday and Thursday.

The low volume "rebound" came to end on Friday as sellers stepped in again creating a sell off that drove the market down right until the closing bell.

Dow Jones Index 4/30/10

As far as individual sectors go, the Financial ETF's (XLF, IAI, IYF), all made another move lower this week.

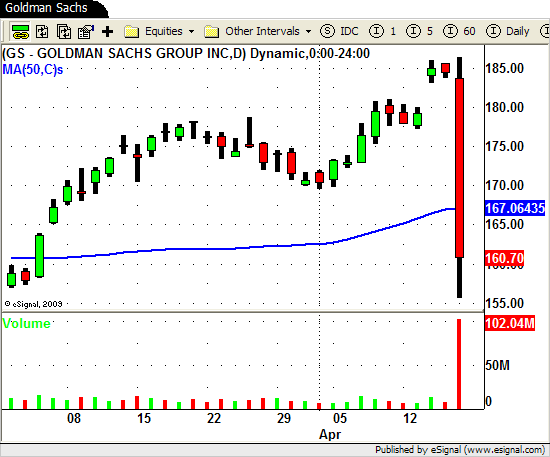
We have been watching this sector closely since the negative news came out about Goldman Sachs.

Last week we noticed, and posted to our blog, that the Financial ETF's were not showing much strength as the market made its move up on Thursday and Friday.

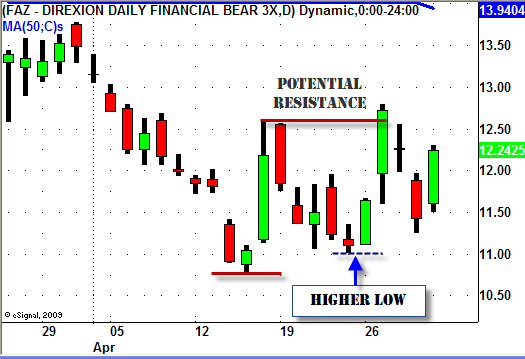
The follow through to the down side started on Monday allowing us go LONG the Inverse Financial ETF (FAZ) for a nice short term swing trade.

FAZ - Swing Trading ETF

After hitting resistance at the short term double top FAZ pulled back a bit and continued its UP move on Friday.

Another sector we have been watching closely is the Steel sector.

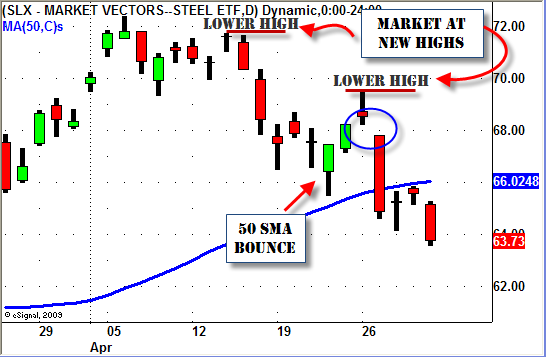
We began to notice the Steel ETF (SLX) was possibly running out of steam during the market move to new highs on April 14th and 15th.

SLX never made it to new highs as the market rallied and actually begin to sell off as the market made its new high on the 15th.

The weakness continued last week and as the market again rallied to NEW HIGHS by Friday, SLX made an unimpressive bounce off of the 50 Day SMA.

When the sellers stepped in on Tuesday this week SLX sold off right out of the gate and never looked back.

The "Gap Down and Go" as we call it created a "lower high" and was a good opportunity for a SHORT Swing Trade in this sector.

SLX - Swing Trading ETF

So what do we do going into next week?

With the market putting in its first significant "lower high" this week we will continue to look for signs of follow through to the down side.

As always though we will continue to look for opportunities on both the LONG and SHORT side of the market just in case the market finds its legs again and makes a run back towards the highs.

Just remember that being prepared for ANYTHING and EVERYTHING increases your chances of trading success.

Until next week…Good trading to YOU!

Swing Trading Week in Review – April 16, 2010

Friday, April 16th, 2010

Does it take bad news about Goldman Sachs to cool the market off?

Goldman Sachs Bad News

After four more days of the continuation rally the market finally ran into a speed bump on Friday.

News came out mid morning that the SEC sued Goldman Sachs in U.S. District Court in Manhattan, claiming the investment bank "committed fraud by misstating or omitting key facts about a synthetic collateralized debt obligation tied to subprime mortgages."

The news sent the market sharply lower, selling off over 150 points intraday, as sellers came out in droves after the news hit the wire.

After such a spectacular rally over the last 2 months this may be the catalyst to finally bring this market back to reality.

Time and time again we advise our students to "be prepared for ANYTHING" as this is a great case in point.

But before we go any further lets take a look at what the market did for the first four days of the week.

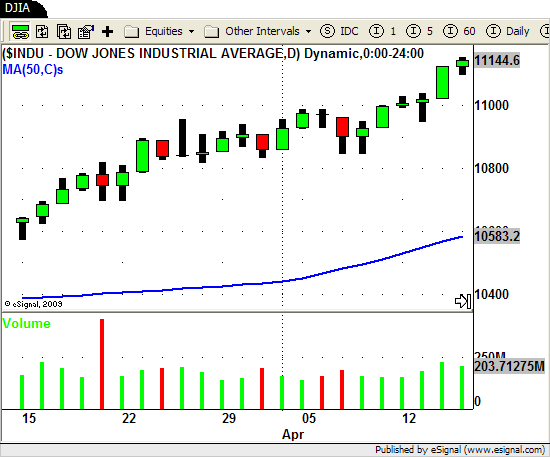
DJIA Swing Trading

You can see from the chart above that the DJIA had another strong first four days of the week and hit another NEW HIGH for the year on Thursday.

One sector that took off like a rocket this week was the Semiconductors.

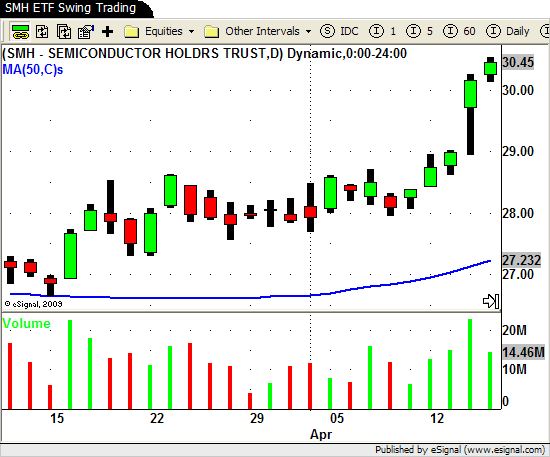
Here is a look at SMH (Semiconductors ETF)…

SMH - ETF Swing Trading

This chart is great combination of Swing Trading using price action, volume and price patterns.

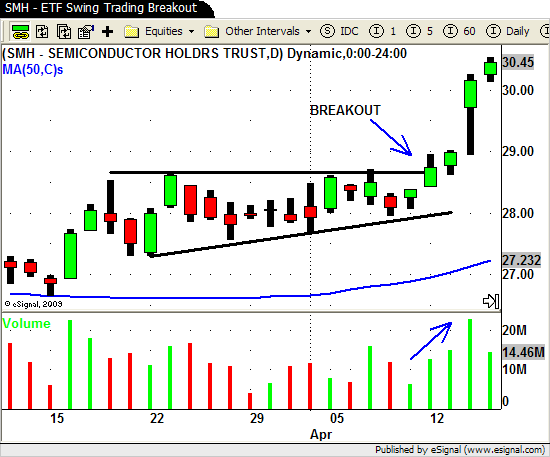
Here is the same chart with annotations.

SMH - ETF Swing Trading Breakout

After consolidating for the last 3 weeks the SMH finally broke out of its price pattern on Monday.

As swing traders this is one of the most popular chart patterns we look for.

Horizontal resistance and an UP trending channel line gives us an ASCENDING TRIANGLE chart pattern.

This chart pattern gives us a LONG trade signal when we see a BREAKOUT above the overhead resistance area.

Notice the VOLUME increase during and after the breakout.

This is exactly what we want to see when we enter into and manage a position.

Indications of strong volume in the direction of our trade when the signal is generated and a continued increase in volume as the trade moves in our favor.

Now lets get back to Fridays trading action.

Being prepared for "anything" is essential if you truly wish to become a successful Swing Trader.

If you were "prepared for ANYTHING" going into Friday you would have a watch list that includes weak stocks, sectors and ETF's.

Our list included several stocks like DVN, SOHU, CAGC, CAAS, MOS and STLD that were showing signs of relative weakness lately.

And depending on your skill level as a swing trader, when Fridays news came out, you could have capitalized on several stocks with "weak" chart patterns.

Stocks like CPRT, NUE, FCX, T and GOLD.

One stock directly influenced by the news with a nice chart pattern was Morgan Stanley (MS).

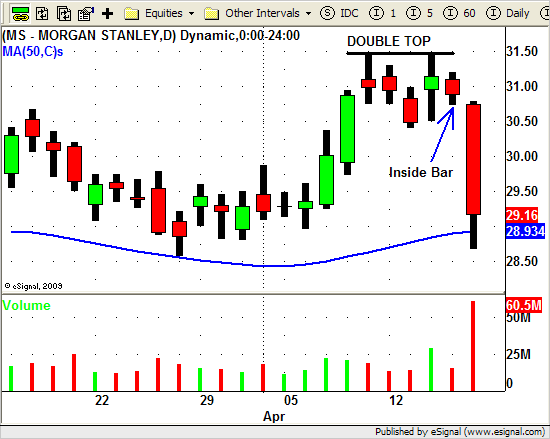
MS Swing Trading Chart Pattern Break Down

After MS formed a short term DOUBLE TOP on Wednesday (at $31.45) it was followed on Thursday by an INSIDE BAR.

INSIDE BARS basically indicate a "stall" in price action especially when LOW VOLUME accompanies this formation.

After Thursday's price and volume action had you taken notice of this temporary "stall" it may have made your "watch" list.

Then when Fridays news came out you would have looked first to MS to see if price action gave you an opportunity to enter into a new SHORT position.

Friday morning MS BROKE DOWN through Thursday's low in the first 5 minutes of trading.

This was your "heads up" since price was now BREAKING DOWN from this pattern.

The entire financial sector was weak all morning and when the news broke around 10:30am MS gave you a great SHORT setup near the $30.50 price level.

Again this is an aggressive trade that should be taken only by experienced swing traders.

Hopefully though it shows you how, with the proper mindset (being prepared for ANYTHING), you can profit when the unexpected opportunity presents itself.

Until next week…Good Trading to YOU!

© Swing Trading Boot Camp 2024