Intraday Swing Trading Strategies – The "3Down" Chart Pattern
This morning we were on the watch (as always) for one of our favorite chart patterns…the "3Down".
We had a few stocks on our list this morning but one stock that stood out like a sore thumb was $MON.
$MON was showing unusual relative strength this morning as the overall market tried to find its way.
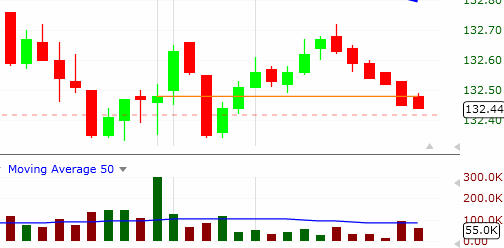
Both the DJIA and S&P both sold off early and hit NEW LOWS on the third 5 minute bar of trading today.
Here is the chart of $DIA…
And now take a look at $MON for comparison…
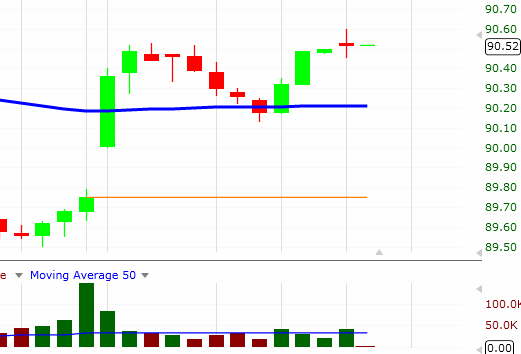
The strength is obvious.
So now that we know we have a strong stock in a relatively weak market what do we do?
We watch and wait.
As the $DIA finds a bottom and start to retrace $MON starts to pullback.
We know at this point that the chances are high that the strength in $MON will not continue if the market starts to push lower again.
If however the overall market transitions from weak to strong then $MON could make its next move higher.
The 10:15am bar is where all the action took place for this trade.
Here is the setup and the countdown chart for the "3Down"…
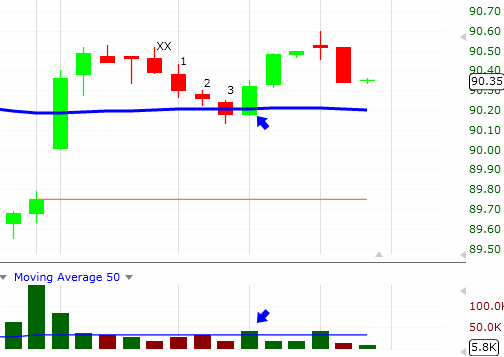
Notice the first attempt to begin our countdown on the chart above.
The bar before the "XX" on the chart is the first "1" bar.
The next bars high is higher than the previous bar so we start over.
The bar after the "XX" starts our new count over at "1" since its higher is lower and its low is also lower than the previous bar.
The next 2 bars do exactly the same thing giving us our "3Down" setup!
Notice also how bar "3" has lower volume than bar "2". This means the selling is drying up.
Now that we have a valid "setup" we wait to see if we get an entry signal.
The 10:15am bar (marked with the BLUE arrow) provides us with a text book entry.
The volume starts pouring into this bar early so we can figure the price action will move one way or the other.
This bars low never trades below the low of the previous bar…bullish!
This bar trades above the high of the previous bar…bullish!
As the bar develops BUYING volume increases…bullish!
We are in the trade at $90.27 (.02 above the previous bars high) and we set our stop at $90.12 (.01 below the previous bars low) for an initial risk of .15/share.
Our STS profit target is at 2x the initial risk (2 x .15 = .30) so we set it at $90.57 ( $90.27 + .30 = $90.57).
Three bars after our entry $MON hits $90.57 (trades up to $90.61) and hits our target before beginning another pullback.

