Posts Tagged ‘stock trading’

Swing Trading Week in Review – April 1,2010

Friday, April 2nd, 2010

What a month March has been!

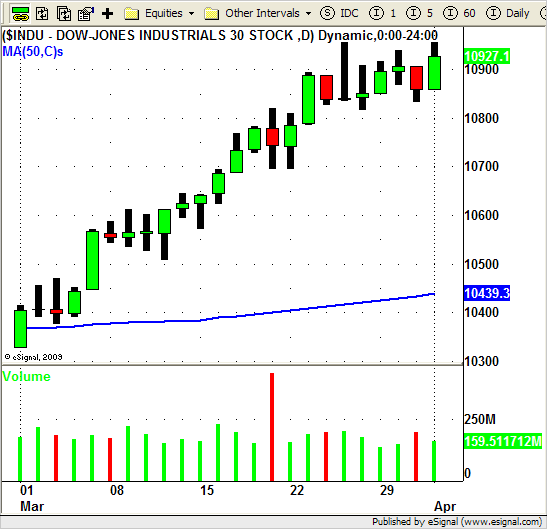
The DOW, S&P and NASDAQ all ended this holiday shortened week at the high for year.

DJIA

March has been a great month for Swing Traders if they were able to get on board this rally at some point during the month.

The markets basically traded sideways until the very end of the week when, on Thursday, the market popped up from the open and ended up rallying into to the close as well.

As far as individual sectors are concerned GOLD (GDX ETF), SILVER (SLV ETF), OIL (OIH ETF)and ENERGY (XLE ETF) all showed signs of life on Thursday after being some of the weakest sectors over the past few weeks.

A few of the strongest sectors, RETAIL (RTH ETF) and REAL ESTATE (IYR ETF), actually took a little break this week and pulled back a bit.

Stocks in these "Hot" sectors may offer Swing Traders another opportunity to get LONG in the near future.

Keep them on your radar and look for Swing Trade set ups that offer the lowest risk and highest reward.

As always…be prepared for ANYTHING!

Until next week…Good trading to YOU!

Swing Trading Week in Review – March 12, 2010

Friday, March 12th, 2010

What a GREAT week for swing traders!

The RALLY continues as the NASDAQ, S&P 500 and several sectors race ahead to NEW HIGHS for the year!

If you listen to some of the talking heads on T.V. you hear that the trading volume for this last up move was very LOW so they remain weary of the the upside potential in the weeks to come.

Now although the "low trading volume" in the broad market MAY be a concern moving forward some of the individual stocks showing great price action and volume patterns for us swing traders!

And despite the DOW's lackluster performance there were stocks all over the place making HUGE upside moves!

Apple (AAPL) closed for the week at its ALL TIME HIGH!

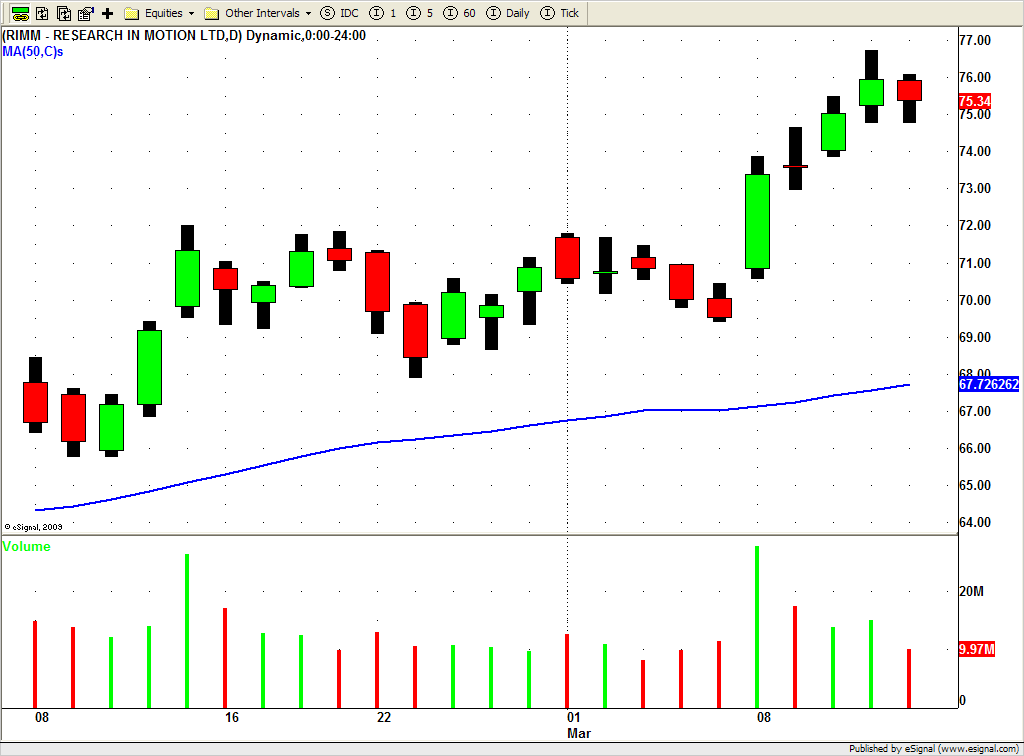
Research in Motion (RIMM) also had a great week, and after breaking through the $72 level it rallied to the upside and closed UP by almost 10% this week!

RIMM

PCAR and LULU we also rock stars this week!

Subscribers to our Swing Trading Newsletters were alerted to numerous BUY set ups this week and a bunch turned out very nicely (if we do say so ourselves)!

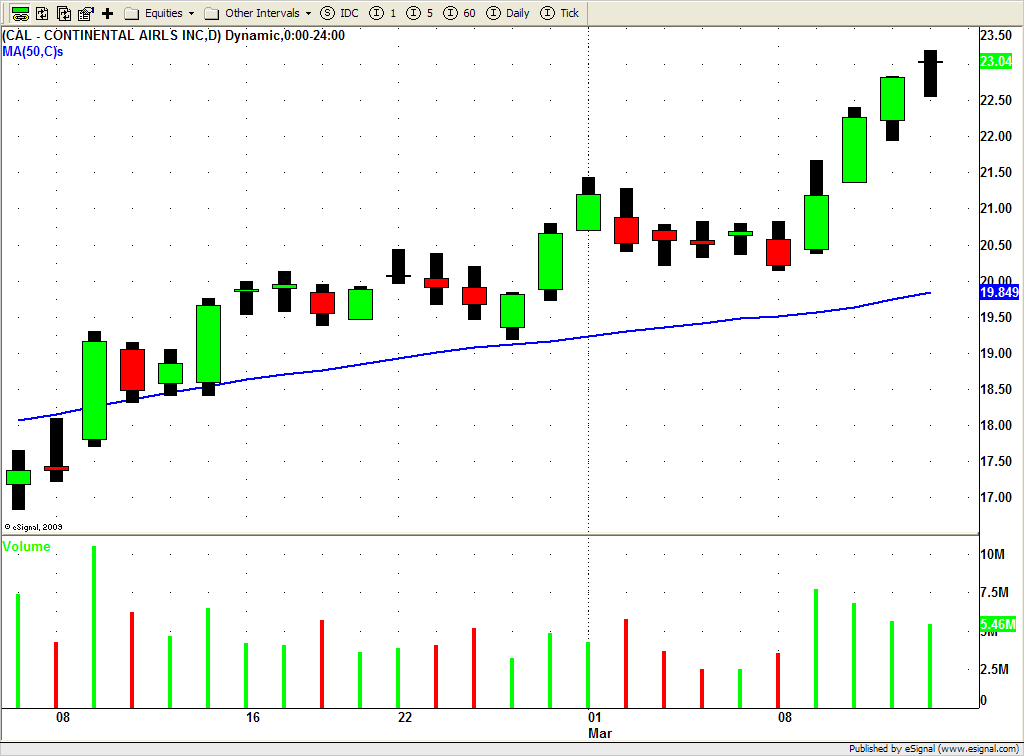
CAL, WYNN, RIMM, and WYN all offered great swing trade opportunities!

CAL Swing Trade

One sector that really took off was the Financial Sector.

Take a look at XLF, IYF, FAS and well as some of the individual names like GS, C, and MET.

The banking sector finished UP 2.5% this week, outpacing the the S&P by more than 2 to 1.

The RETAIL (RTH) and REAL ESTATE ( IYR) sectors also continued their impressive rally with both sectors closing at their highest point of the year as well.

SPG, KIM, O and DRE continued their runs after showing great chart patterns for us last Friday.

Oil (OIH), Energy (XLE) and the semiconductors (SMH) all basically sat this last rally out.

So will these sectors play catch up or will they sell off when the market finally takes a break and pulls back a bit?

Only time will tell but for now we will continue to focus on the sectors and stocks that are showing tremendous relative strength.

Until next week…Good Trading to YOU!


Swing Trading Week in Review – February 26, 2010

Friday, February 26th, 2010

A pullback in market this week but what an interesting pullback it was!

The markets opened this week with a low volume lackluster Monday.

Tuesday the market popped out of the gate but quickly rolled over confirming the retrace was underway.

As we noted last week we entered into several new SHORT positions by the close on Friday.

These SHORT positions (AMSC comes to mind) sold off nicely with the market and we booked profits on most of these trades.

Wednesday price "stalled" on low trading volume again creating an "inside day".

Then on Thursday things got a little interesting…

The market gapped down BIG TIME on Thursday but buyers stepped in and the market rallied strong and closed near the high of the day on BIG VOLUME.

Then the week finished off with a low range, choppy day on Friday.

A few interesting things to note here.

During this most recent pullback we saw the buyers step into the market when prices retraced "far enough" and drove prices right back up.

There was only one day, Tuesday, when the market closed BELOW the swing high of 10314.84 that was put in on February 2nd.

We told you last week that until the week shows us which way its going we will continue to play both sides of the market.

Thursday's price action had us looking to the LONG side and we were able to find several strong stocks with chart patterns that were just too good to pass up!

One sector really shined that really shined this week?

RETAIL!

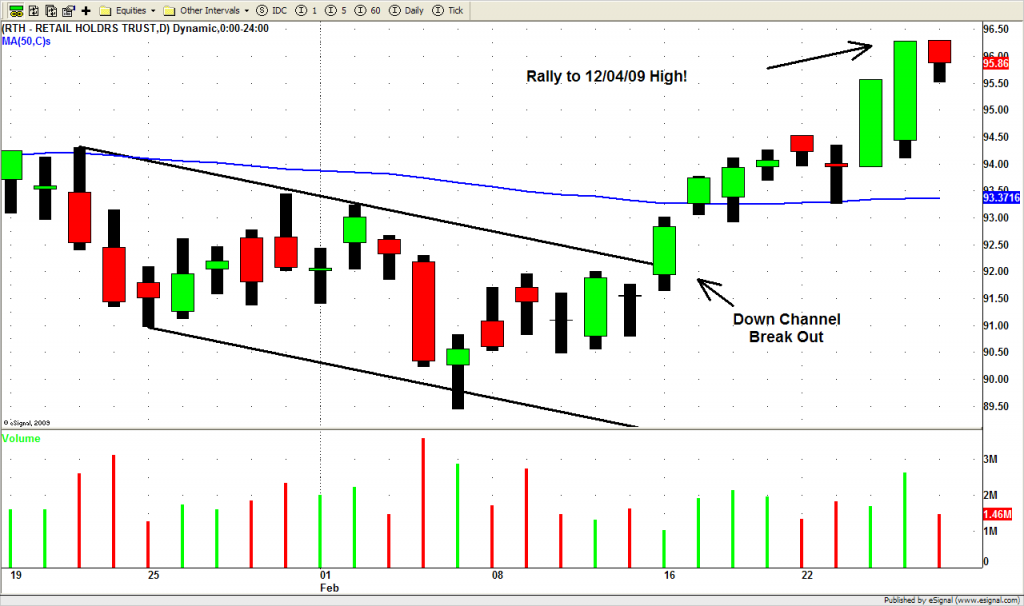
Yes retail…the RTH…broke its DOWN TREND CHANNEL last week and after a mere one day pullback on Tuesday it rallied nicely right into Friday.

RTH - Retail Sector ETF

TIF, M, HD and ANN all had nice UP moves this week.

On the other end of the spectrum is the SOLAR sector.

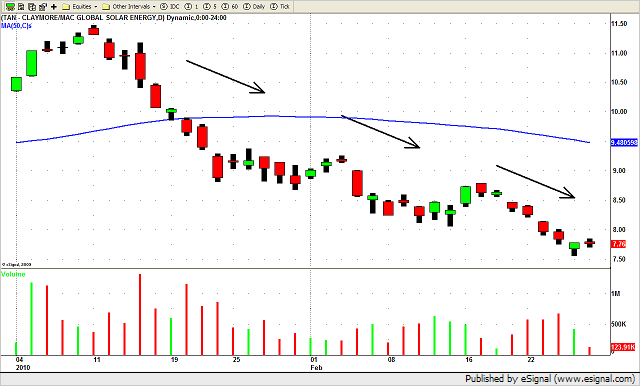
The SOLAR ETF, symbol TAN, continued its downward spiral finishing just off the low of year.

TAN - SOLAR ETF

So once again we find ourselves at a crossroads.

UP or DOWN?

LONG or SHORT?

Want our opinion?

We say….WHO CARES!

Have a great trading plan in place and be prepared for whichever way the market goes from here.

If you are getting whipsawed in this current environment then reduce your trading size or even sit on the sidelines until YOU see the trading set ups that make the most sense to YOU and your trading style!

Hopefully next week we can get some follow through one way or the other.

Until next week…Good Trading to YOU!


Swing Trading Week in Review – January 22, 2010

Friday, January 22nd, 2010

The DOW fell over 4% (over 400 points) this week closing at 10172.98.

The S&P 500 and NASDAQ followed suit also selling off around 4% each as well.

After last weeks price action (see last post) we took notice of the potential down move in the market.

When the market opened Tuesday, after being closed for the holiday on Monday, the market rallied strong and turned in a positive day closing near the highs of the day.

Traders had to think that the market could possibly be making another attempt towards the recent highs.

Our job as traders or active investors is to look for clues that the market gives to make our trading decisions.

Our clue that Tuesdays market action was a possible "fake out" was once again price action AND volume.

Even though the market had a nice up move on Tuesday the volume was light.

The volume clue was not only evident in the overall market but in the sector ETF's and individual stocks as well.

Lets look at the charts we posted last week to see how they played out.

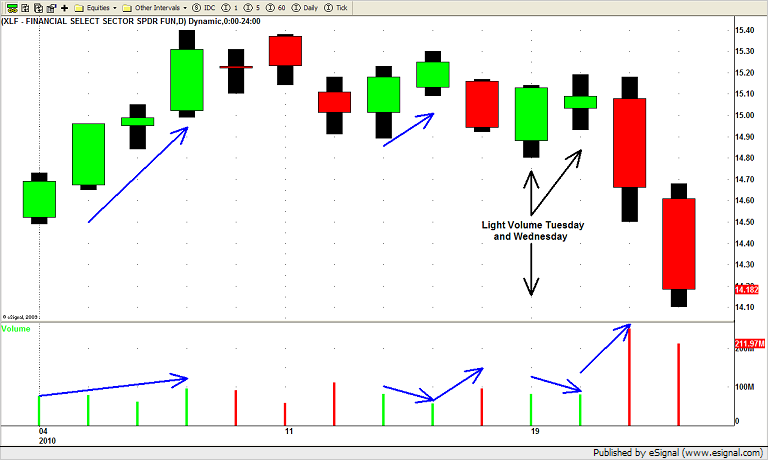
First we take at look at the XLF (Financials ETF).
XLF ETF

Tuesday's light volume reversal day as followed by a lighter volume day on Wednesday with price closing near the mid point of the day.

Price action AND volume then follow through to the DOWN side nicely on Thursday and Friday.

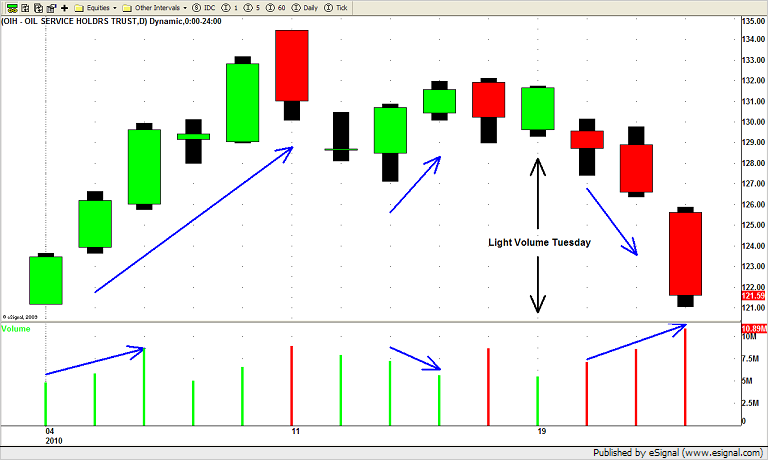
Here is the OIH (Oil Servies ETF) chart.
OIH

You can see how even though the sector had a nice up day on Tuesday the volume was light.

Wednesdays price action (down) on increasing volume confirmed that price was heading lower (even if only temporarily).

The selling accelerated on Thursday and Friday pushing price lower closing near the lows of the week.

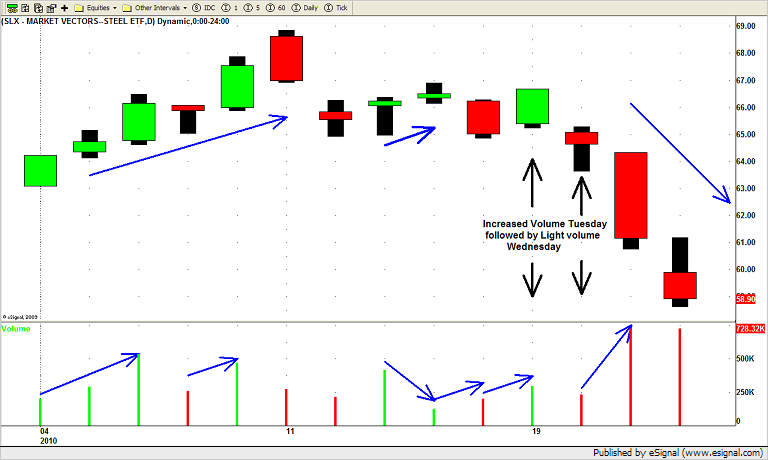
And finally lets look at the SLX (Steel ETF) chart we posted last week.
SLX ETF

This one was a little tricky for a few reasons.

The Steel sector has been on fire recently so when Tuesday's price and volume action showed a possible run towards the recent highs we entered into a new LONG position.

By Wednesdays open we knew we were probably wrong on this trade but as always we stick to our trading plan and dont try to out guess the market.

Wednesdays gap down and lackluster price movement on low volume was quickly followed by increased volume and downward price movement as selling finally came into the sector Thursday and Friday.

Yes we were stopped out for a LOSS on this trade but it happens and will happen again.

Our SHORT positions more than made up for this one losing trade.

One, for example, that played out perfectly was our SHORT SWING TRADE in ANF.
ANF Short Swing Trade

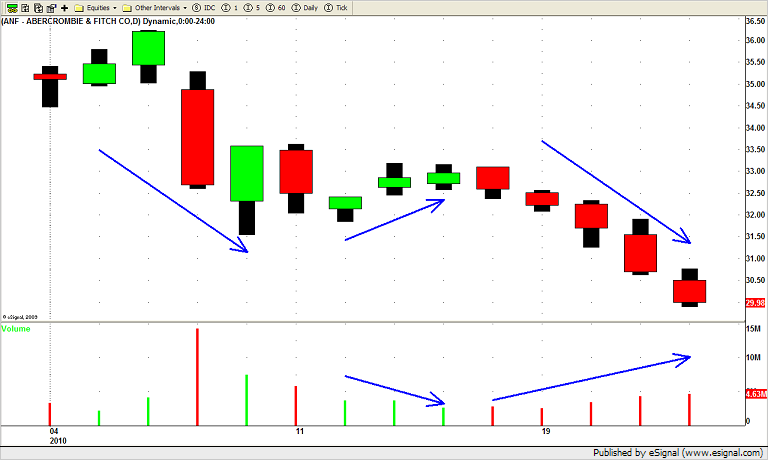
ANF triggered a SHORT SWING TRADE for us last Friday (1/15/2010).

The sector (retail) has been weak and ANF was showing signs of obvious weakness as well.

Notice how ANF did not participate in the markets UP move on Tuesday as price "stalled" on lower volume.

Wednesday ANF quickly followed through by trading lower on increased volume and the rest of the week was more of the same.

At pivotal times in the market we frequently find ourselves having a few LONG positions (in stocks showing relative strength) and a few SHORT positions (in stocks showing relative weakness).

Once the market gives us a clear signal (like it did this week) we can take the appropriate action and get on the right side of the market.

Until next week…Good Trading to you!
© Swing Trading Boot Camp 2025