Swing Trading Blog Post – "Double Top" Chart Pattern
Last week, in the midst of the 9 day "mini" rally, we notified our Swing Trading Newsletter subscribers of several stocks and ETF's that were forming interesting chart patterns.
As the market became short term "over bought" we noticed LRCX approaching at level that it reached in late April.
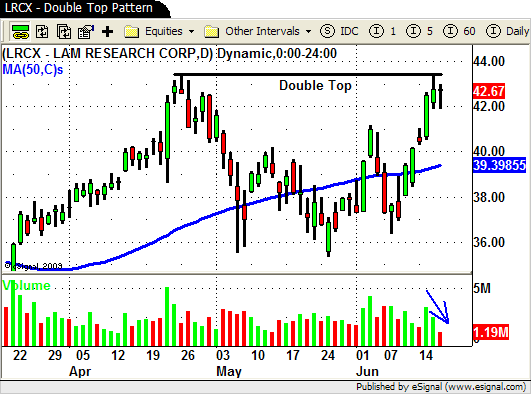
Here you can see the chart that we posted to our subscribers (and the hint we gave on Twitter) last Thursday.

Thursday was the first day we noticed LRCX "stall" as price action created an "inside day" on decreased volume.
This was just a heads up to our subscribers that a "double top" MAY be forming but to wait for CONFIRMATION before entering into a SHORT position (if their trading strategy called for shorting in this context).
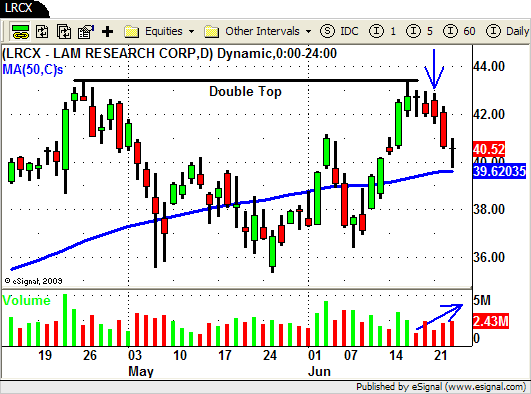
On the chart below you can see that on Friday (the day after our alert) price creates another "inside day" this time on increasing volume.
This type of "stalling" price action is something we would expect near an overhead resistance level but just because price "stalls" it is NOT a signal for us to take action (get LONG or SHORT) just yet.

When the market GAPPED UP big time on Monday you will notice that LRCX did NOT gap up nearly as much.
LRCX stayed within the prior days range even though the market (and several other sectors) gapped up way above the prior days HIGH.
The market quickly rolled over on Monday and by the end of the day LRCX triggered our SHORT entry (BLUE ARROW) as it traded down through Fridays LOW ($41.89), confirming the "double top" pattern.
Just a reminder that since this "counter trend" strategy we consider this an advanced swing trading strategy that should only be taken by experienced swing traders.
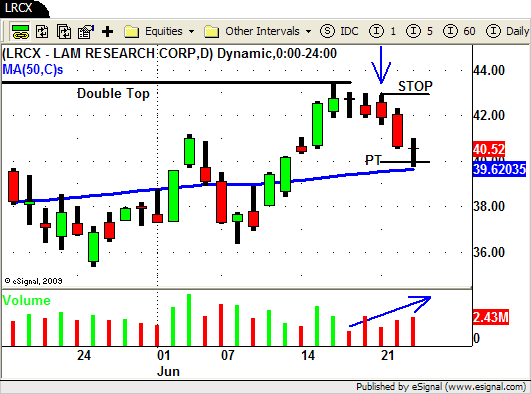
That being said we typically use the HIGH on our ENTRY DAY as our initial stop level for this strategy.
Our entry price for the SHORT trade was .02 below Friday's low…$41.87.
The HIGH of our entry day price bar was actually exactly $1 above at $42.87 so we set our actual stop .02 above that at $42.89 giving us an initial risk of $1.02/share.
Using our standard PROFIT TARGET of 2:1 for this type of trade we set our target at $39.85 ($41.87 – $2.02).
Below you can see how the trade turned out.

Although we like to see confirming VOLUME action when we enter into a trade we always put PRICE ACTION first.
Often times we will see VOLUME follow through the next day (after entry) just as it did here on Tuesday.
This morning LRCX traded down and hit our PROFIT TARGET ($39.85) before turning around and closing the day basically "mid-bar".
Price could continue LOWER from here but this type of strategy ("counter trend") calls for "precise" entries which allow for smaller profit targets.
Being alert to the potential "double top" that was forming we were able into a profitable short term swing trade once we received confirmation that the pattern was in place.
