With GOLD and the GOLD MINERS ETF's showing recent relative strength we have a few of the stocks, including AEM, on our watch list.
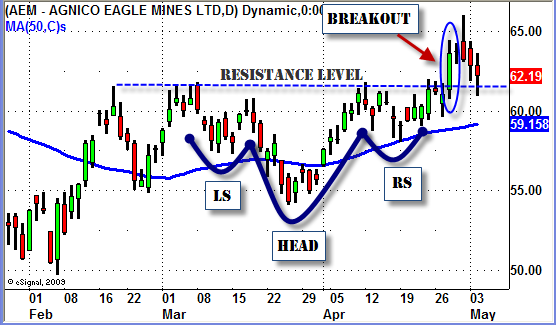
You can see on the chart above how AEM has broken out of an "inverted" Head and shoulders pattern which began to form nearly two months ago.
The overhead resistance was clear in the $61.50 to $62 price level.
So now that AEM has pulled back from its recent high we will look for confirming price action to see if the previous resistance area will now become a new support level.
If the UP move in AEM continues the next possible resistance level would be in the $68.50 area.
