Posts Tagged ‘GS’

Swing Trading Week in Review – April 30, 2010

Saturday, May 1st, 2010

After making NEW YEARLY HIGHS on Monday the market finished down almost 1.8% this week.

Sellers came out in force on Tuesday but the market quickly rebounded Wednesday and Thursday.

The low volume "rebound" came to end on Friday as sellers stepped in again creating a sell off that drove the market down right until the closing bell.
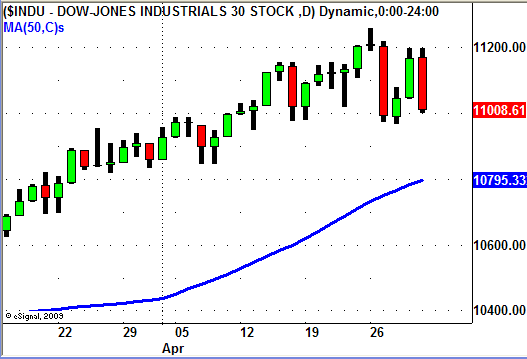
Dow Jones Index 4/30/10

As far as individual sectors go, the Financial ETF's (XLF, IAI, IYF), all made another move lower this week.

We have been watching this sector closely since the negative news came out about Goldman Sachs.

Last week we noticed, and posted to our blog, that the Financial ETF's were not showing much strength as the market made its move up on Thursday and Friday.

The follow through to the down side started on Monday allowing us go LONG the Inverse Financial ETF (FAZ) for a nice short term swing trade.
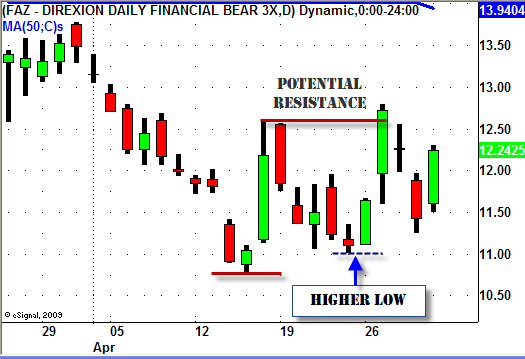
FAZ - Swing Trading ETF

After hitting resistance at the short term double top FAZ pulled back a bit and continued its UP move on Friday.

Another sector we have been watching closely is the Steel sector.

We began to notice the Steel ETF (SLX) was possibly running out of steam during the market move to new highs on April 14th and 15th.

SLX never made it to new highs as the market rallied and actually begin to sell off as the market made its new high on the 15th.

The weakness continued last week and as the market again rallied to NEW HIGHS by Friday, SLX made an unimpressive bounce off of the 50 Day SMA.

When the sellers stepped in on Tuesday this week SLX sold off right out of the gate and never looked back.

The "Gap Down and Go" as we call it created a "lower high" and was a good opportunity for a SHORT Swing Trade in this sector.
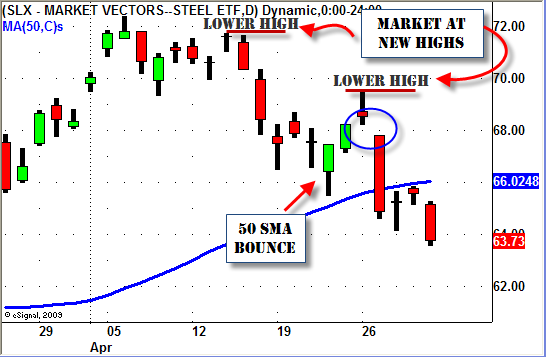
SLX - Swing Trading ETF

So what do we do going into next week?

With the market putting in its first significant "lower high" this week we will continue to look for signs of follow through to the down side.

As always though we will continue to look for opportunities on both the LONG and SHORT side of the market just in case the market finds its legs again and makes a run back towards the highs.

Just remember that being prepared for ANYTHING and EVERYTHING increases your chances of trading success.

Until next week…Good trading to YOU!

Swing Trading Week in Review – April 16, 2010

Friday, April 16th, 2010

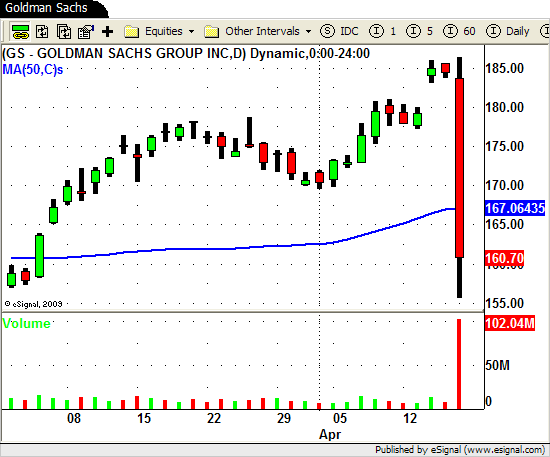
Does it take bad news about Goldman Sachs to cool the market off?

Goldman Sachs Bad News

After four more days of the continuation rally the market finally ran into a speed bump on Friday.

News came out mid morning that the SEC sued Goldman Sachs in U.S. District Court in Manhattan, claiming the investment bank "committed fraud by misstating or omitting key facts about a synthetic collateralized debt obligation tied to subprime mortgages."

The news sent the market sharply lower, selling off over 150 points intraday, as sellers came out in droves after the news hit the wire.

After such a spectacular rally over the last 2 months this may be the catalyst to finally bring this market back to reality.

Time and time again we advise our students to "be prepared for ANYTHING" as this is a great case in point.

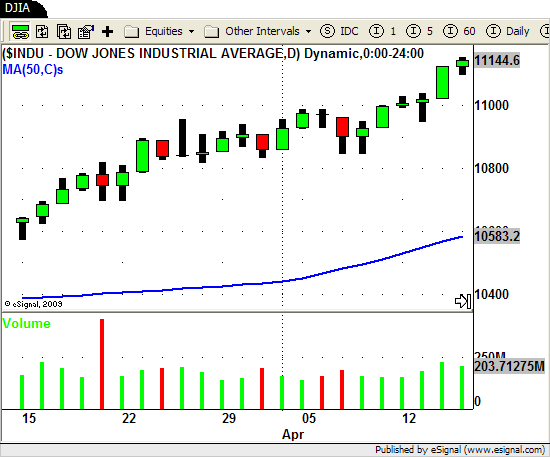
But before we go any further lets take a look at what the market did for the first four days of the week.

DJIA Swing Trading

You can see from the chart above that the DJIA had another strong first four days of the week and hit another NEW HIGH for the year on Thursday.

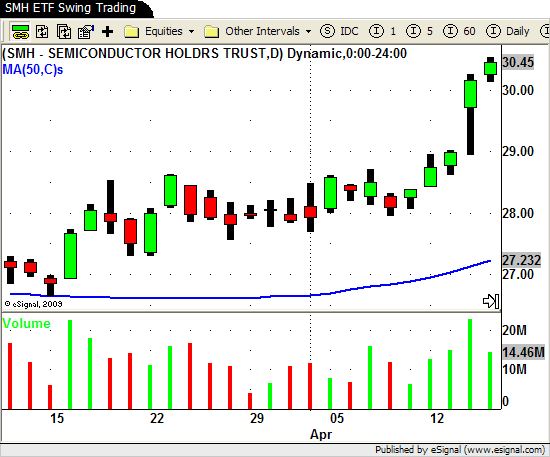
One sector that took off like a rocket this week was the Semiconductors.

Here is a look at SMH (Semiconductors ETF)…

SMH - ETF Swing Trading

This chart is great combination of Swing Trading using price action, volume and price patterns.

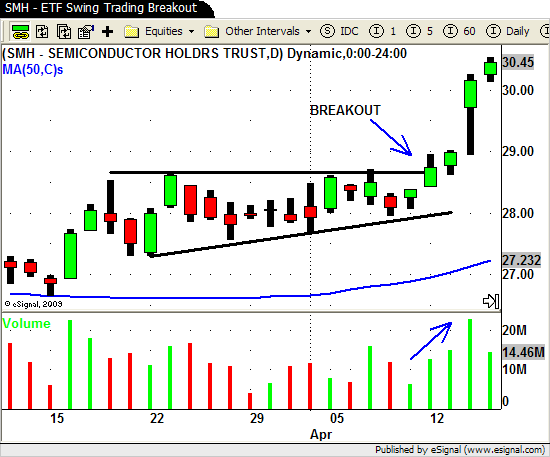
Here is the same chart with annotations.

SMH - ETF Swing Trading Breakout

After consolidating for the last 3 weeks the SMH finally broke out of its price pattern on Monday.

As swing traders this is one of the most popular chart patterns we look for.

Horizontal resistance and an UP trending channel line gives us an ASCENDING TRIANGLE chart pattern.

This chart pattern gives us a LONG trade signal when we see a BREAKOUT above the overhead resistance area.

Notice the VOLUME increase during and after the breakout.

This is exactly what we want to see when we enter into and manage a position.

Indications of strong volume in the direction of our trade when the signal is generated and a continued increase in volume as the trade moves in our favor.

Now lets get back to Fridays trading action.

Being prepared for "anything" is essential if you truly wish to become a successful Swing Trader.

If you were "prepared for ANYTHING" going into Friday you would have a watch list that includes weak stocks, sectors and ETF's.

Our list included several stocks like DVN, SOHU, CAGC, CAAS, MOS and STLD that were showing signs of relative weakness lately.

And depending on your skill level as a swing trader, when Fridays news came out, you could have capitalized on several stocks with "weak" chart patterns.

Stocks like CPRT, NUE, FCX, T and GOLD.

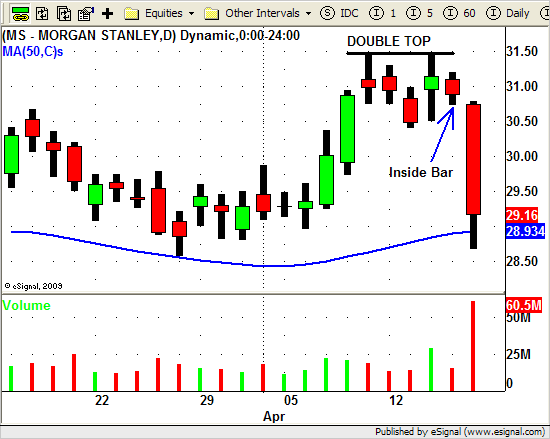
One stock directly influenced by the news with a nice chart pattern was Morgan Stanley (MS).

MS Swing Trading Chart Pattern Break Down

After MS formed a short term DOUBLE TOP on Wednesday (at $31.45) it was followed on Thursday by an INSIDE BAR.

INSIDE BARS basically indicate a "stall" in price action especially when LOW VOLUME accompanies this formation.

After Thursday's price and volume action had you taken notice of this temporary "stall" it may have made your "watch" list.

Then when Fridays news came out you would have looked first to MS to see if price action gave you an opportunity to enter into a new SHORT position.

Friday morning MS BROKE DOWN through Thursday's low in the first 5 minutes of trading.

This was your "heads up" since price was now BREAKING DOWN from this pattern.

The entire financial sector was weak all morning and when the news broke around 10:30am MS gave you a great SHORT setup near the $30.50 price level.

Again this is an aggressive trade that should be taken only by experienced swing traders.

Hopefully though it shows you how, with the proper mindset (being prepared for ANYTHING), you can profit when the unexpected opportunity presents itself.

Until next week…Good Trading to YOU!

Swing Trading Week in Review – March 12, 2010

Friday, March 12th, 2010

What a GREAT week for swing traders!

The RALLY continues as the NASDAQ, S&P 500 and several sectors race ahead to NEW HIGHS for the year!

If you listen to some of the talking heads on T.V. you hear that the trading volume for this last up move was very LOW so they remain weary of the the upside potential in the weeks to come.

Now although the "low trading volume" in the broad market MAY be a concern moving forward some of the individual stocks showing great price action and volume patterns for us swing traders!

And despite the DOW's lackluster performance there were stocks all over the place making HUGE upside moves!

Apple (AAPL) closed for the week at its ALL TIME HIGH!

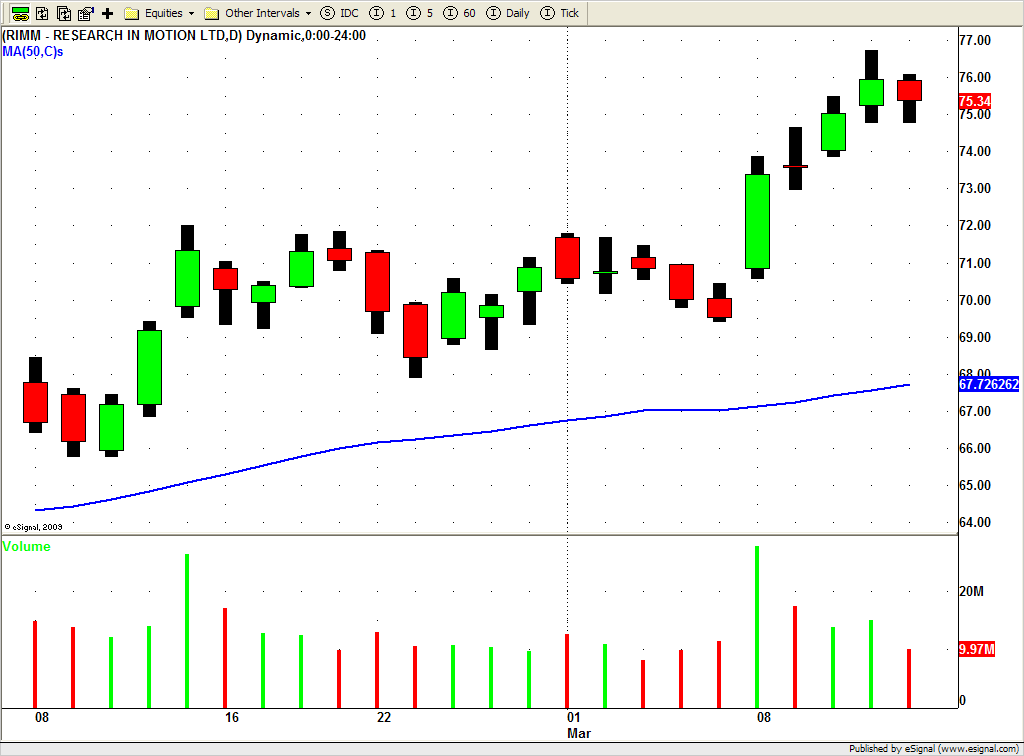
Research in Motion (RIMM) also had a great week, and after breaking through the $72 level it rallied to the upside and closed UP by almost 10% this week!

RIMM

PCAR and LULU we also rock stars this week!

Subscribers to our Swing Trading Newsletters were alerted to numerous BUY set ups this week and a bunch turned out very nicely (if we do say so ourselves)!

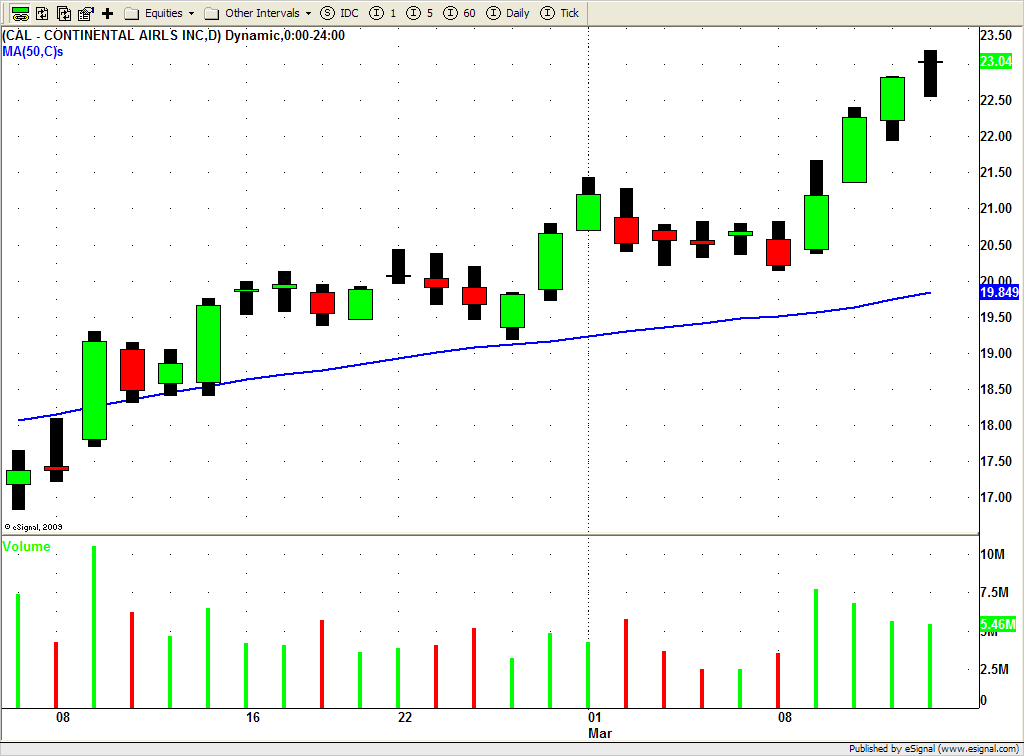
CAL, WYNN, RIMM, and WYN all offered great swing trade opportunities!

CAL Swing Trade

One sector that really took off was the Financial Sector.

Take a look at XLF, IYF, FAS and well as some of the individual names like GS, C, and MET.

The banking sector finished UP 2.5% this week, outpacing the the S&P by more than 2 to 1.

The RETAIL (RTH) and REAL ESTATE ( IYR) sectors also continued their impressive rally with both sectors closing at their highest point of the year as well.

SPG, KIM, O and DRE continued their runs after showing great chart patterns for us last Friday.

Oil (OIH), Energy (XLE) and the semiconductors (SMH) all basically sat this last rally out.

So will these sectors play catch up or will they sell off when the market finally takes a break and pulls back a bit?

Only time will tell but for now we will continue to focus on the sectors and stocks that are showing tremendous relative strength.

Until next week…Good Trading to YOU!


Off to a good start for 2010

Saturday, January 9th, 2010

So the New Year started off with a bang!

The markets continued to show tremendous strength during the first trading week of 2010.

The Dow opened the the week at 10,430 and never looked back, closing up 1.8% at 10,618!

The S&P 500 was up 2.7% for the week and closed at 1144.

Some of the sectors were absolutely on fire!

Steel stocks were on a roll and stocks like X, AKS, STLD, and NUE all had a big  week.

SLX, the Market Vector Steel ETF, finished up almost 10% for the week.

Energy and Oil stocks also continued to rise with stocks like BHI, DO, RIG,and APC having great weeks.

OIH was up over 11% for the week while XLE finished up almost 6%.

The heavily watched financial and home builder sectors also show some very nice upside moves.

The home builders had some great swing trade set ups.

XHB closed up over 7% for the week after breaking out from a nice pattern on the daily chart.

PHM, LEN, DHI and MTH all finished the week up nicely.

Swing traders should have capitalized on the financials as GS, JPM , and WFC all had BIG weeks after breaking their respective DOWN TREND lines.

Casinos, Airlines and Solar stocks also had a great week

Some of the other sectors, however did not fare very well during this strong week in the market.

The retail sector had a weak showing with a few exceptions like RL and BBBY.

The Real Estate sector also had a weak showing with IYR only up a tad over break even for the week.

There were plenty of opportunities for Swing Traders to profit from last weeks action and we hope you were able to do just that!

We look forward to see what next week brings and Good Trading to you!

© Swing Trading Boot Camp 2024