Posts Tagged ‘ETF Swing Trading’

Swing Trading Week in Review – June 15,2012

Sunday, June 17th, 2012

Swing Trading BLOG – Swing Trading BOOT CAMP
DIA - Swing Trading BLOG

A nice week for the major indicies this week.

That being said was probably better to be a day trader this week instead of an overnight swing trader.

The intraday moves were very nice and offered reliable chart patterns to trade while the over night moves were less predictable.

See how we trade our Intraday Swing Trading Strategy here.

After a BIG GAP UP on Monday morning the sellers stepped in to bring the market down to end the day.

Tuesday didn't draw much excitement but starting on Wednesday the market started to show signs of moving higher.

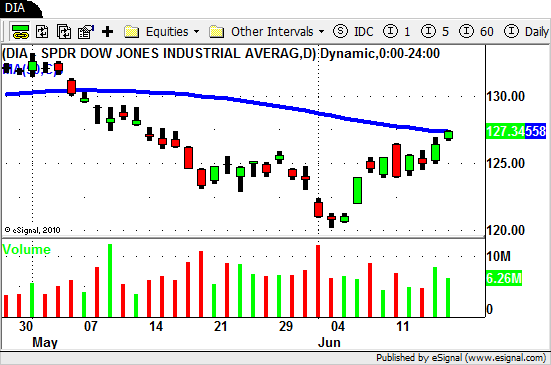
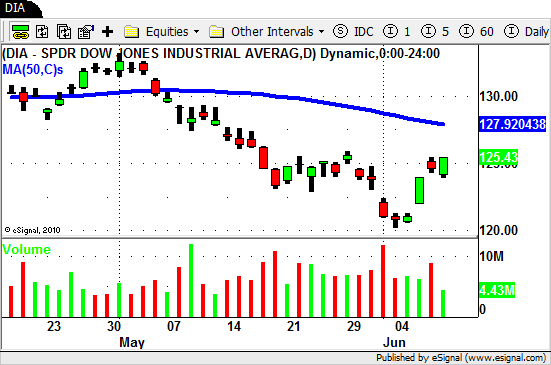
Fridays close brought the DJIA right up to its 50 day SMA while the S&P and Nasdaq aren't far behind.

A few of the sector ETF's showed signs of life as well while others are showing extreme relative weakness.

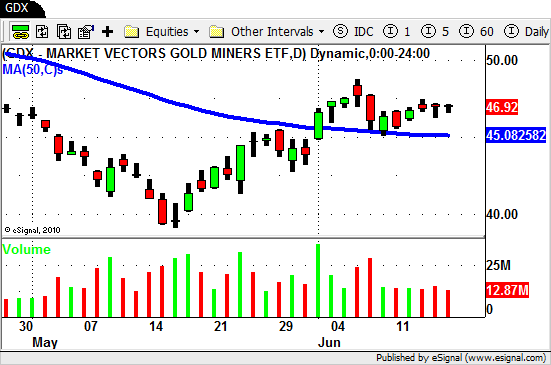
The Gold ETF's continue to trade above their 50 day SMA's and although Silver hasn't quite caught up just yet it looks to be showing signs of strength.
GDX - Swing Trading Blog

As next weeks trading begins things could change in a hurry.

With all the news coming out next week be prepared for the markets to move very quickly. One side will win the "tug of war" and you will miss the moves if you aren't ready.

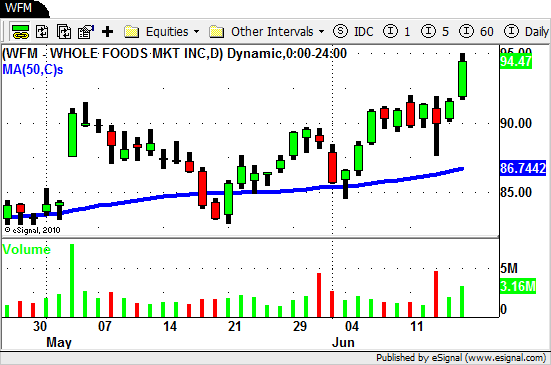
Look for stocks bucking the down trend (i.e. $WFM $EQIX) to add to your LONG watch list.
WFM - Stwing Trading Blog

Look for those stocks that did not hold up well this week to add to your SHORT watch list.

Have a plan in place so whatever the market decides to do from here you will be prepared to act (and hopefully profit).

Until next week…Good Trading to YOU!

Swing Trading Week in Review – June 8, 2012

Sunday, June 10th, 2012

Swing Trading Blog – Swing Trading Boot Camp

$DIA - Swing Trading ETF

Swing Traders watched as the market puts in it's best week of the year this week.

After nothing but doom and gloom and talks of the next wave of the recession looming the market took off like a rocket this week.

But not everything is peaches and cream in stock market land just yet.

For one thing the volume on the recent UP move has been lackluster at best.

You can't really argue that it's summer time since the SELLING VOLUME we saw just 2 weeks ago spoke loud and clear.

Secondly all three indicies and almost every sector ETF are still trading below their 50 day SMA's.

The markets haven't traded under their 50 day SMA's for this long since the third quarter of last year.

And finally we still have plenty of overhead resistance to break through before I would start looking for the bull to return for any length of time.

Lets be honest…it still a bearish short term market (for now).

So what is your swing trading strategy in a market like this?

Our strategy remains the same. We SHORT (or use inverse ETF's) we the market is weak and go LONG when the market is strong.

At times of transition in the market we start to see less follow and tend to get stopped out a bit more.

As SHORT TERM TRADERS these are the clues that keep us on the right side of the market.

If the market does start to turn to the upside we will notice and hopefully be able to profit from it.

Have a trading plan in place so whatever the market decides to do from here you will be ready.

Until next week…Good Trading to You!

Swing Trading Week in Review – June 1, 2012

Sunday, June 3rd, 2012

Swing Trading Blog – Swing Trading Boot Camp

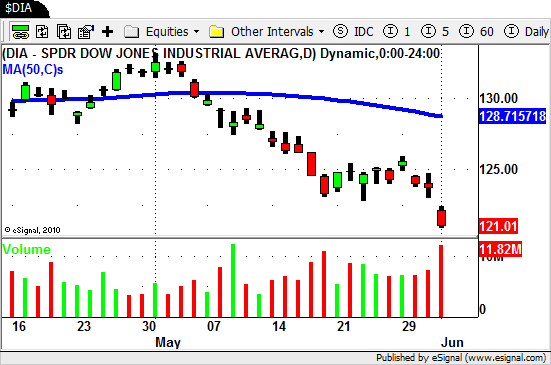
After finding some temporary support last week the markets SOLD OFF hard this week.

After being closed on Monday traders watched the market GAP UP on Tuesday.

On Wednesday though all hopes of a meaningful bounce disappeared as the market GAPPED DOWN and the sellers stepped in to drive the market lower.

Another big GAP DOWN on Friday and continued strong selling pushed the market NEW LOWS for the 2012.

It's amazing what can happen in 1 month.

On May 1st we hit NEW HIGHS for 2012 and here, exactly 1 month later, we are looking at NEW LOWS for the year.

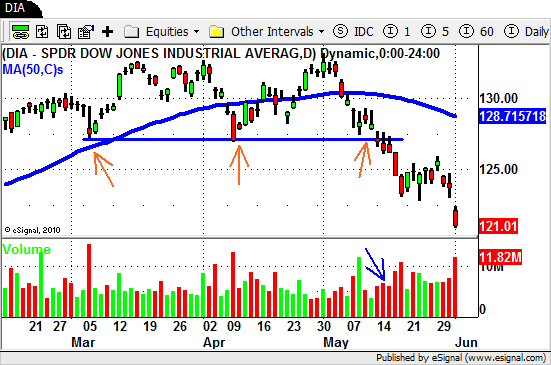
Let's take a look at the transition from BULL to BEAR…

In February we traded to NEW HIGHS and then sold off a bit in early March.

Buyers stepped back in and once again brought the market higher (1st Orange Arrow).

After some sideways trading we once again hit NEW HIGHS on April 2nd but once again we couldn't go any higher.

Sellers stepped and drove the market down to the same level it hit in early March (2nd Orange Arrow).

These levels were accompanied by BIG VOLUME which tells us that there is a lot of activity at that level in the market.

The BUYING volume obviously won since we once again drifted higher to close out the month of April.

We opened up the Month of May by hitting NEW HIGHS once again.

We immediately stalled and another sell off began this time on volume.

This sell off took the market right back to the key area in the market that we touched 2 times before (3rd Orange Arrow).

It is around these key levels (of support this time) that we look for the clues the market gives us.

In mid May we finally BROKE DOWN through this support level as volume picked up (Blue arrow).

The mode of the market had now changed. Sentiment was different.

This BREAK DOWN on INCREASED VOLUME is what we needed to see to change from BULLISH to BEARISH.

Once this level was broken it was time for us to aggressively move the the SHORT side of the market.

If you follow the market and analyze PRICE ACTION and VOLUME it can paint a very clear picture for you.

Until next week…Good Trading to YOU!
Swing Trading Week in Review – March 2, 2012

Friday, March 2nd, 2012

Swing Trading BLOG – Swing Trading Boot Camp

$DIA - Swing Trading ETF

Going nowhere in a hurry!

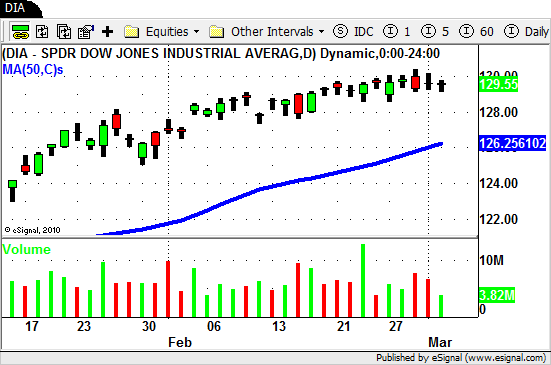
Swing traders watched as the Dow Jones Industrial Average (DJIA) flirted with 13,000 again this week. 

Disappointment set in though as the market failed to make a significant move to the up side.

The NASDAQ did a bit better by rallying up to new highs.

The individual sector again was mixed.

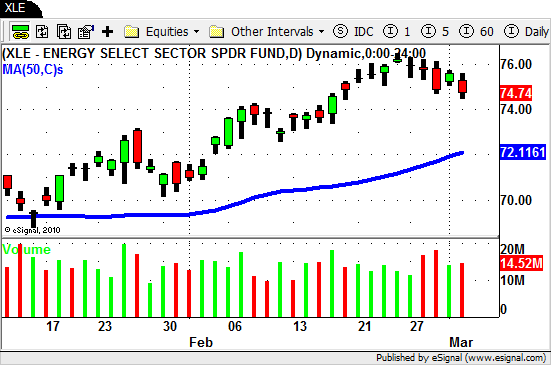
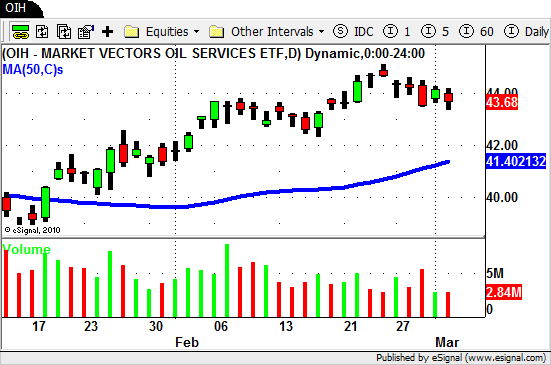
Energy ($XLE) and Oil ($OIH) pulled back this week after a nice rally.

$XLE - Swing Trading ETF $OIH - Oil Services ETF

The Retail ($RTH) and Financial ETF's are sitting at new highs while Real Estate ($IYR), Steel ($SLX) and the Semiconductors ($SMH) are well off their recent highs but still holding their 50 day SMA's.

The Gold ($GLD $GOLD $GDX) and Silver ($SLV) ETF's were a different story.

After showing signs of strength early in the week both sectors got hammered after "the Fed" comments on Wednesday.

Stocks were mixed as well this week.

There are plenty of rock star stocks out there.

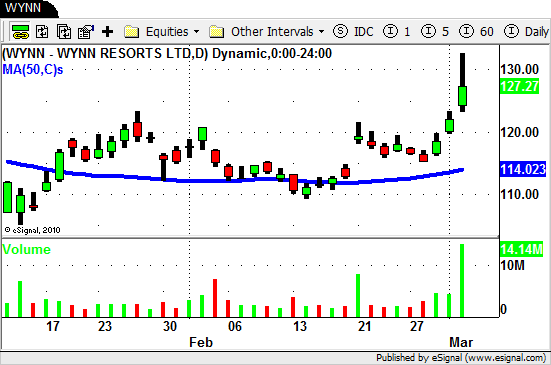
$ADBE $WYNN $AAP $ORLY and the ever impressive $AAPL.

$WYNN
All in all this week was a bit frustrating as traders watched for a strong move that never came.

It is still a very bullish market but there are a few signs on slowing in some of the sectors.

Can this market find its legs again?

No one knows for sure but as always be prepared for whatever the market decides to do from here.

Until next week…Good Trading to You!

© Swing Trading Boot Camp 2024