The DOW fell over 4% (over 400 points) this week closing at 10172.98.
The S&P 500 and NASDAQ followed suit also selling off around 4% each as well.
After last weeks price action (see last post) we took notice of the potential down move in the market.
When the market opened Tuesday, after being closed for the holiday on Monday, the market rallied strong and turned in a positive day closing near the highs of the day.
Traders had to think that the market could possibly be making another attempt towards the recent highs.
Our job as traders or active investors is to look for clues that the market gives to make our trading decisions.
Our clue that Tuesdays market action was a possible "fake out" was once again price action AND volume.
Even though the market had a nice up move on Tuesday the volume was light.
The volume clue was not only evident in the overall market but in the sector ETF's and individual stocks as well.
Lets look at the charts we posted last week to see how they played out.
First we take at look at the XLF (Financials ETF).
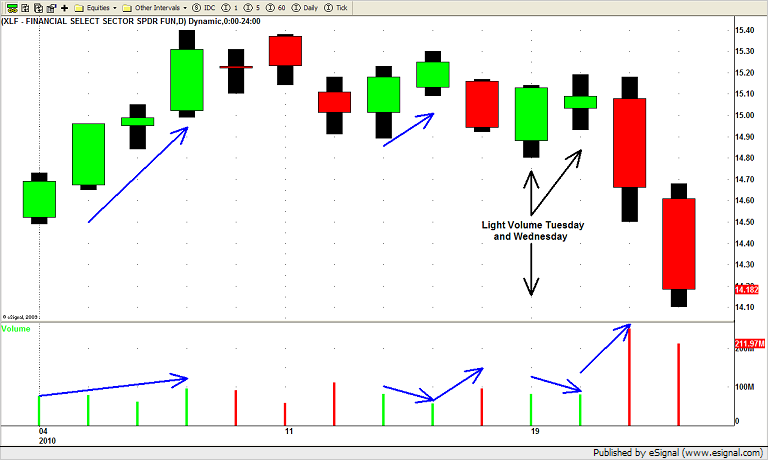
Tuesday's light volume reversal day as followed by a lighter volume day on Wednesday with price closing near the mid point of the day.
Price action AND volume then follow through to the DOWN side nicely on Thursday and Friday.
Here is the OIH (Oil Servies ETF) chart.
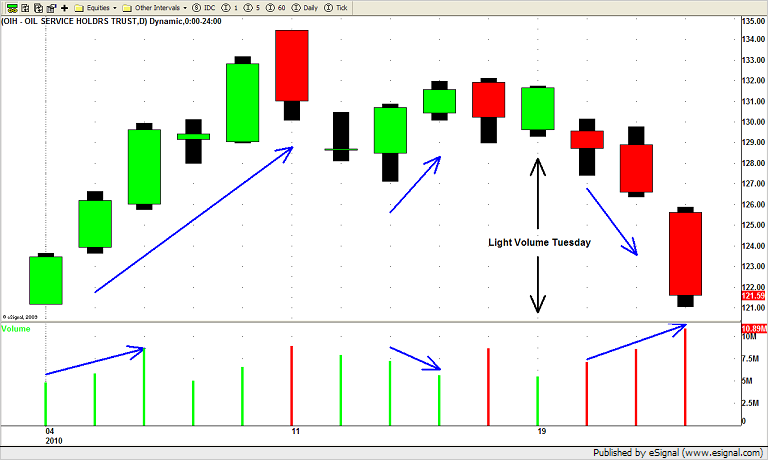
You can see how even though the sector had a nice up day on Tuesday the volume was light.
Wednesdays price action (down) on increasing volume confirmed that price was heading lower (even if only temporarily).
The selling accelerated on Thursday and Friday pushing price lower closing near the lows of the week.
And finally lets look at the SLX (Steel ETF) chart we posted last week.
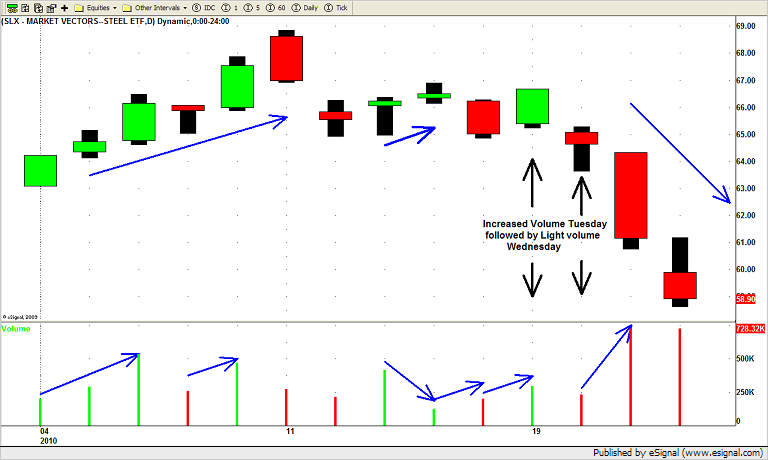
This one was a little tricky for a few reasons.
The Steel sector has been on fire recently so when Tuesday's price and volume action showed a possible run towards the recent highs we entered into a new LONG position.
By Wednesdays open we knew we were probably wrong on this trade but as always we stick to our trading plan and dont try to out guess the market.
Wednesdays gap down and lackluster price movement on low volume was quickly followed by increased volume and downward price movement as selling finally came into the sector Thursday and Friday.
Yes we were stopped out for a LOSS on this trade but it happens and will happen again.
Our SHORT positions more than made up for this one losing trade.
One, for example, that played out perfectly was our SHORT SWING TRADE in ANF.
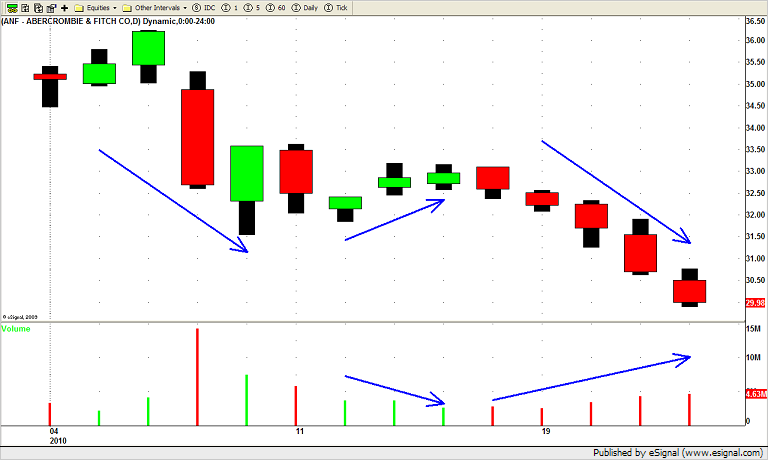
ANF triggered a SHORT SWING TRADE for us last Friday (1/15/2010).
The sector (retail) has been weak and ANF was showing signs of obvious weakness as well.
Notice how ANF did not participate in the markets UP move on Tuesday as price "stalled" on lower volume.
Wednesday ANF quickly followed through by trading lower on increased volume and the rest of the week was more of the same.
At pivotal times in the market we frequently find ourselves having a few LONG positions (in stocks showing relative strength) and a few SHORT positions (in stocks showing relative weakness).
Once the market gives us a clear signal (like it did this week) we can take the appropriate action and get on the right side of the market.
Until next week…Good Trading to you!
