Fibonacci Swing Trading – XHB
Fibonacci Swing Trading the Homebuilders ETF
In this article we will take a look a recent Swing Trade we made in the Homebuilders ETF (XHB).
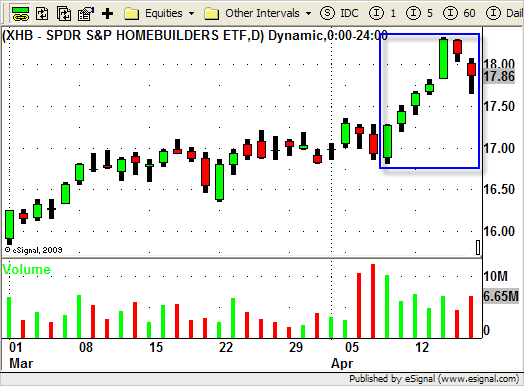
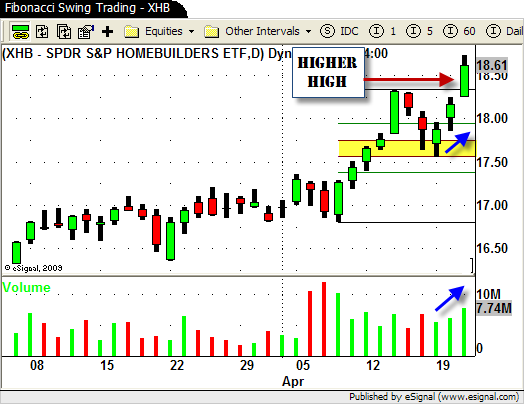
As you can see from the chart XHB finally broke out of consolidation and rallied nicely to new highs just above the $18 level.
On the final two bars in the chart above you can see where XHB "stalls", creating a INSIDE BAR, and then begins to retrace on the final bar of the chart.
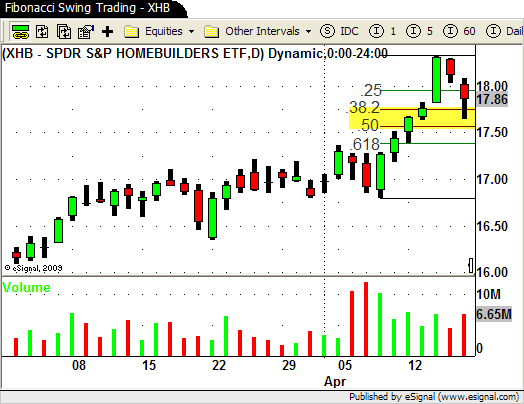
Once the retrace is underway we can now use Fibonacci Analysis to locate retracement levels for possible trade setups.
The retracement levels are shown on the chart and we have highlighted in yellow the area we consider to be the "sweet spot" for locating possible areas of support.
The "sweet spot" as we call it is the area located between the .382 and the .50 retracement levels.
As price enters into this area we look for "clues" and confirming price action that the retrace has ended and that price may continue in the same direction prior to the retrace.
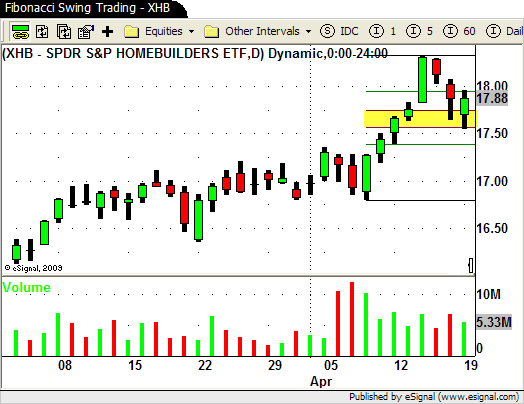
On the last bar of the chart below you can see that XHB trades down to the .50 retracement level but actually closes the day well above this area and also closes above the days open.
Notice that this was also on lower volume.
This was clue #1 that the retrace was losing steam and may have come to an end.
Once we notice this type of price and volume action in our "sweet spot" we create a trading plan for a possible LONG swing trade.
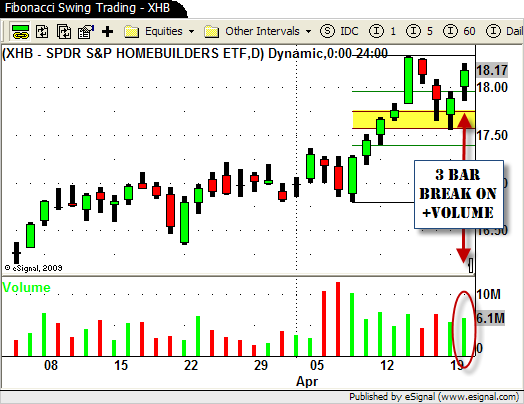
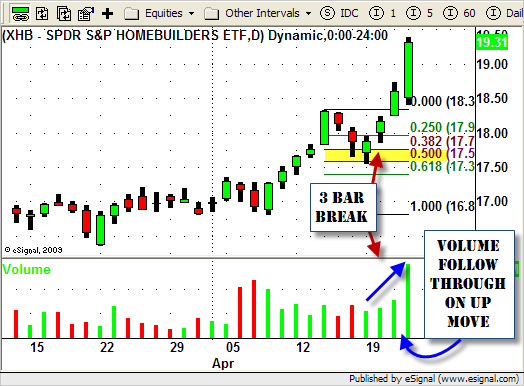
In this example we would use our "3 Bar Break" swing trading strategy and look to enter into a LONG trade if tomorrow price trades above todays high.
Our trigger is hit the next day as price actually gaps up above our entry price.
We enter around the $18 level and set our initial stop just below the low of the prior day ($17.55).
Once we are in the trade we now need to manage our position and look for confirming price action and volume to determine our next action.
The next day price gaps up again (a good sign) and rallies nicely and closes near its high thus creating a "higher high".
Volume also increases as price moves to new highs…another good sign.
Now depending or your strategy you could move your stop up to break even at this point.
The next day XHB follows through nicely as price again moves higher on increasing volume.
Again, depending on your strategy, you could exit some or all of your positions on this move.
This is really a classic example of using Fibonacci Analysis to locate potential swing trades.
Locating "meaningful moves" to measure is one of the keys to locating key Fibonacci Retracement levels.
Once you have located a "meaningful move" use Fibonacci Analysis to locate retracement levels where a new trade opportunity may occur.
Once you have located your "sweet spot" look for confirming price action to enter into a new trade.

