Archive for the ‘Technical Analysis’ Category

Swing Trading Week in Review – June 18, 2010

Friday, June 18th, 2010

As the market continued its recent up move our "short term" LONG swing trades turned out nicely.

After bouncing off of the February lows the market has moved up for the last 9 days straight.
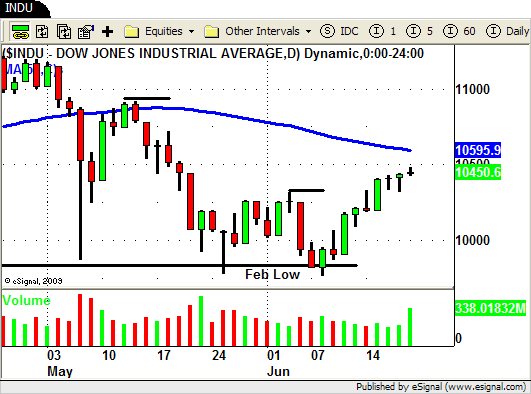
DJIA  Daily Chart

As you know from our last few BLOG posts we entered into some LONG swing trades (in strong stocks) as the market confirmed its "bounce" off of the February lows.

Strong stocks like ALK, AKAM and NTAP (chart below) hit their profit targets this week.
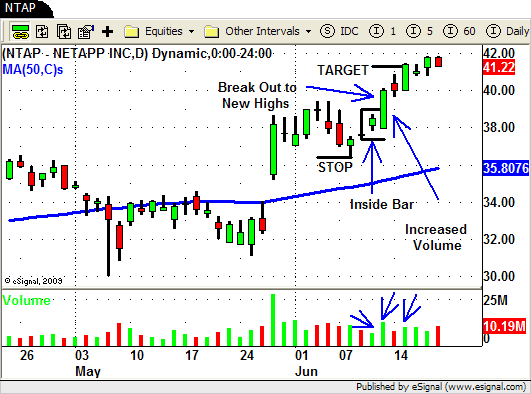
NTAP - Swing Trade

One of the strong stocks the we did not take a trade in but also turned out nicely was MELI.
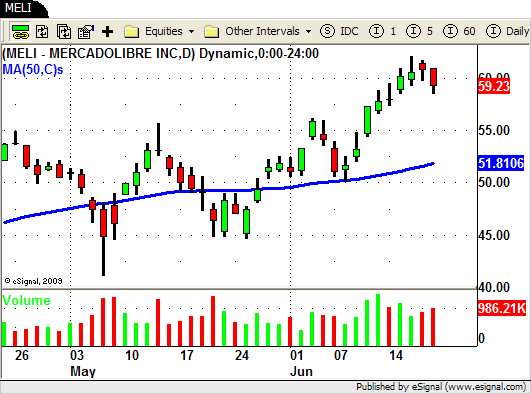
MELI - Swing Trade

MELI made a nice run to new yearly highs as the market made its "bounce".

In tonight's webinar we discussed how we determined which stocks and ETF's to trade during this last move in the market.

One of the biggest "clues" we look for is when a stock or ETF shows strength or weakness in relation to what the overall market is doing.

Look at the stocks we listed above.

All of the stocks above were showing signs of strength as the market was trading down to the February lows.

As the market confirmed its "double bottom" price pattern these strong stocks and ETF's were putting in a higher low prior to taking off to new highs.

The strongest stocks were also trading above their 50 period SMA, a basic filter we use to determine strength or weakness, while the market was trading well below it.

In contrast the weaker ETF's (and individual stocks) were the ones that made new lows or lower lows as the market "double bottomed".

Take a look at the chart of the DOW (above) and compare it to the RTH and XHB (below).
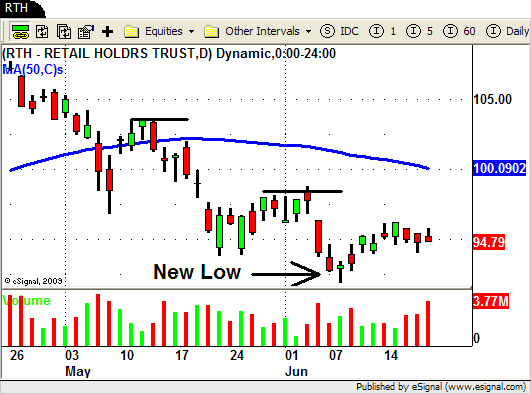
RTH - Swing Trade

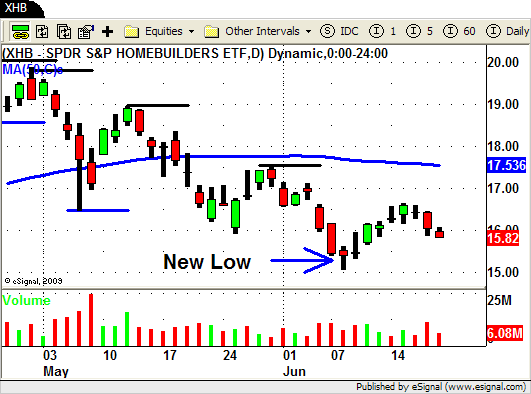
XHB - ETF Swing Trade

You can see how both sectors made new lows as the market put in the "double bottom" on June 8th.

We steered clear of these sectors during the recent up move and will continue to do so until they show signs of becoming at least as strong (and preferably stronger) than the overall market.

By locating the "clues" that these stocks and ETF's were giving us we were able to make some profitable LONG trades in a then down trending environment.

If you have any questions about the trades we entered into this week please post them below…we would love to hear from you!

Until next week…Good Trading to YOU!


Intraday Swing Trading

Saturday, June 12th, 2010

Can you "swing" trade intraday?

This seems to be a question that comes up a lot.

"Swing Trading" is typically defined as…a method or strategy used to profit from short term (1-4 day) price moves in the market.

Although the standard definition defines the typical length of time in a trade (1-4 days) another definition for "Swing Trading" is used to describe a method or strategy used to profit from "price swings" in the market.

This definition can be used for a trading strategy or method regardless of the time frame.

A "price swing" is used to describe the ebb and flow of price action.

As price moves from one point to the next it typically does so in back and forth wave like motions.

When price moves from a low point on the chart to a higher point this is typically identified as an "up swing".

The opposite is true for a "down swing" in price.

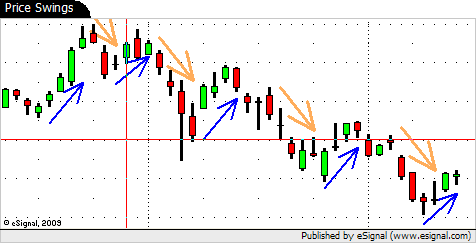
In the chart below we have identified the UP price swings with a BLUE arrow and the DOWN price swing with an ORANGE arrow.

Price Action - Price Swings

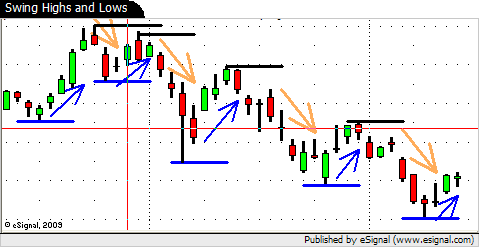
The alternating "swing" extremes are further identified as "swing highs" and "swing lows" once they begin to retrace from their highest or lowest point.

Here is the same chart with the "swing" highs (black horizontal lines) and "swing" lows (blue horizontal lines) in place.

Swing Highs and Lows - Swing Trading Price Action

So now that we have the terminology and definitions out of the way lets get back to the original question.

Using the second definition of a "Swing Trader" you can surely see how a day trader can trade the "price swings" in the market.

In fact in the two charts above you probably cant even tell if they are DAILY charts or INTRADAY charts since the price and time data has been removed.

Our main strategy for overnight Swing Trading is based on locating strong or weak stocks (and sectors) in relation to the market and trading these stocks (and ETF's) based on the context of the overall market conditions.

When we trade the "price swings" intraday we use the exact same strategy!

If the market is strong we are scanning the market looking for the strongest stocks and ETF's.

Once we locate thees strong stocks we then use technical analysis (price action, volume and trend lines) to locate and hopefully profit from the intraday "price swings".

We want to be in sync with the market so if the market has run up (UP swing), retraced (DOWN swing), we are looking for LOW RISK trade setups in the strongest stocks and ETF's.

That way if the market decides to make another UP swing we can enter into and hopefully profit from this next price swing in the market.

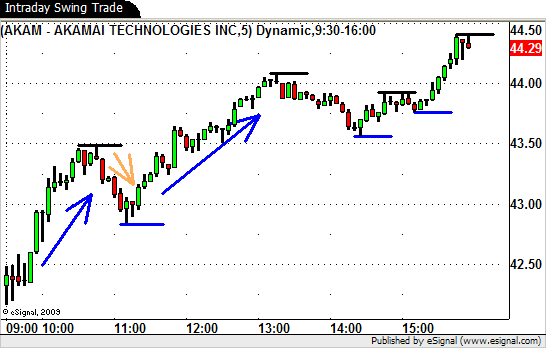
On the intraday (5 minute) chart below of AKAM you can see the first UP swing as price rallies from the open all the way up to just under $43.50.

AKAM then heads lower (retraces) creating a DOWN swing (orange arrow).

Overall the market was strong and the strength in AKAM from the open was obvious.

We are then anticipating another UP swing in AKAM if and when the market starts to show some signs of also moving up.


Intraday Swing Trading

We were able to enter into this intraday swing trade in AKAM just over $43 as the new "swing low" was put in place and the next UP swing in price began.

Although we are never sure how long the next "price swing" will last in this example AKAM ran up to just over $44 ( a one dollar move) before starting its next DOWN swing.


This is just one example of how you can "swing trade" intraday.

Although they may need some tweaking the potential strategies and ideas that you have for overnight swing trading can surely be utilized on an intraday basis.

© Swing Trading Boot Camp 2024