Archive for the ‘Swing Trading Strategies’ Category

Intraday Swing Trading [Video] – Price Action and Volume

Wednesday, January 9th, 2013

Our Intraday swing trading strategies using price action and volume for the end of day trades for January 9, 2013.

When day trading stocks and ETFs we always watch what the overall market is doing and use that as a guide for our trades.

In this video I show you how the DJIA ($DIA) was attempting to trade lower in the last half hour of trading.

$BA was showing signs of relative strength and gave us a nice chart pattern to trade into the close.


Intraday Swing Trading Strategies – The “3Down” Chart Pattern

Thursday, December 13th, 2012

Intraday Swing Trading Strategies – The "3Down" Chart Pattern

This morning we were on the watch (as always) for one of our favorite chart patterns…the "3Down".

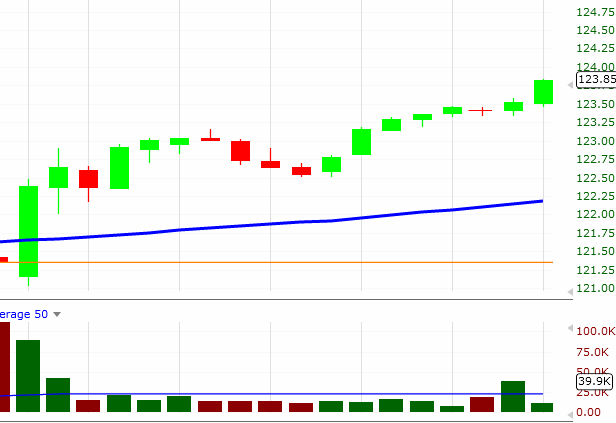
We had a few stocks on our list this morning but one stock that stood out like a sore thumb was $MON.

$MON was showing unusual relative strength this morning as the overall market tried to find its way.

Both the DJIA and S&P both sold off early and hit NEW LOWS on the third 5 minute bar of trading today.

Here is the chart of $DIA…
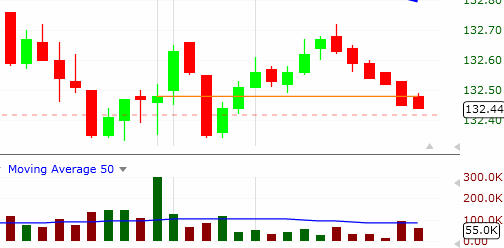
$DIA - Intraday Swing Trading Strategies

And now take a look at $MON for comparison…
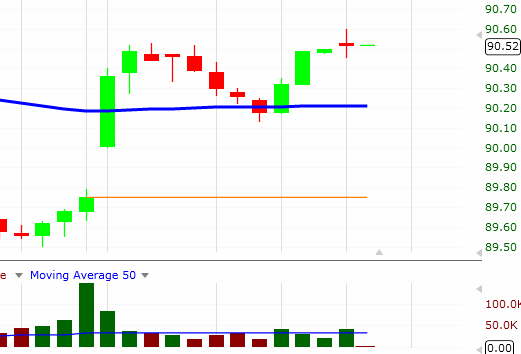
$MON - Intraday Swing Trading

The strength is obvious.

So now that we know we have a strong stock in a relatively weak market what do we do?

We watch and wait.

As the $DIA finds a bottom and start to retrace $MON starts to pullback.

We know at this point that the chances are high that the strength in $MON will not continue if the market starts to push lower again.

If however the overall market transitions from weak to strong then $MON could make its next move higher.

The 10:15am bar is where all the action took place for this trade.

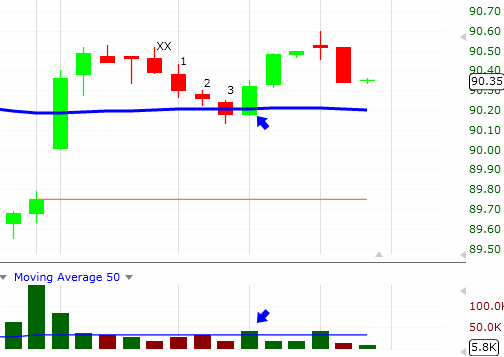
Here is the setup and the countdown chart for the "3Down"…
$MON - Intraday Swing Trading

Notice the first attempt to begin our countdown on the chart above.

The bar before the "XX" on the chart is the first "1" bar.

The next bars high is higher than the previous bar so we start over.

The bar after the "XX" starts our new count over at "1" since its higher is lower and its low is also lower than the previous bar.

The next 2 bars do exactly the same thing giving us our "3Down" setup!

Notice also how bar "3" has lower volume than bar "2". This means the selling is drying up.

Now that we have a valid "setup" we wait to see if we get an entry signal.

The 10:15am bar (marked with the BLUE arrow) provides us with a text book entry.

The volume starts pouring into this bar early so we can figure the price action will move one way or the other.

This bars low never trades below the low of the previous bar…bullish!

This bar trades above the high of the previous bar…bullish!

As the bar develops BUYING volume increases…bullish!

We are in the trade at $90.27 (.02 above the previous bars high) and we set our stop at $90.12 (.01 below the previous bars low) for an initial risk of .15/share.

Our STS profit target is at 2x the initial risk (2 x .15 = .30) so we set it at $90.57 ( $90.27 + .30 = $90.57).

Three bars after our entry $MON hits $90.57 (trades up to $90.61) and hits our target before beginning another pullback.

Intraday Swing Trading with PVT

Tuesday, December 11th, 2012

Intraday swing trading 

As day traders we use the PVT method (price action, volume and trend lines) day in and day out.

Yesterday we saw some great examples of PVT in action.

PVT - Price Action Trading Example

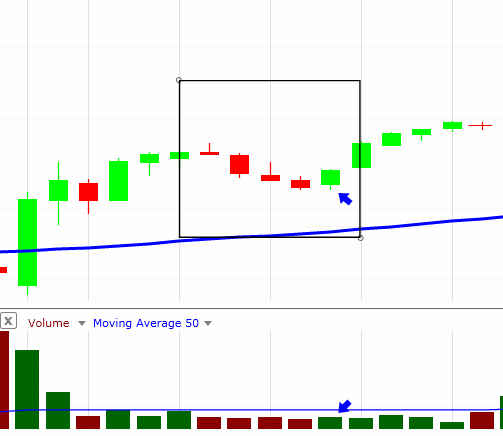
On the chart above you can see a nice up trending stock. Let's focus on the area highlighted in the box on the chart below.

PVT - Price Action Trading Example

In this chart you can see one of the text book set ups of the PVT method.

The stock has already made a NEW HIGH for the day so we now that so far we are dealing with a strong stock.

The box on the chart above shows you the first retrace after the high was made.

We look for these retraces to flush out the sellers. 

Once we know the retrace is in effect we look for the clues that price action and volume give us to let us know if the next move will be higher.

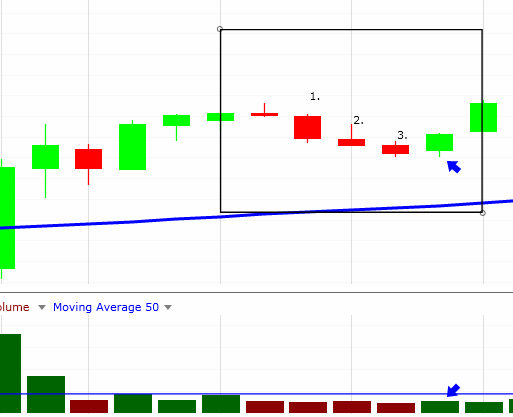
In this example the retrace begins one bar after the daily high was established. We marked this as "1." on the chart below.

PVT - Price Action Trading Example

This bar is followed by 2 more bars (marked 2. and 3.) which gives us our "3Down" chart pattern that we love.

After a "3Down" we watch to see if price action AND volume work together to give us an entry signal.

The next bar after our "3Down" pattern (the blue arrow on the chart) we see the tell tale signs of the next UP move.

We notice that as the bar progresses it never trades below the low of the previous bar…a bullish sign.

We also notice that volume is increasing and as this 5 minute bar comes to an end we KNOW that we have increased volume.

We also see this bar trading higher than the high of the previous bar.

As of this together is a text book entry using the PVT method.

Once the entry is made we simply manage our position and watch as price action/volume continue to tell a story.


Swing Trading Week in Review – December 7, 2012

Sunday, December 9th, 2012

Swing Trading Boot Camp – Swing Trading BLOG

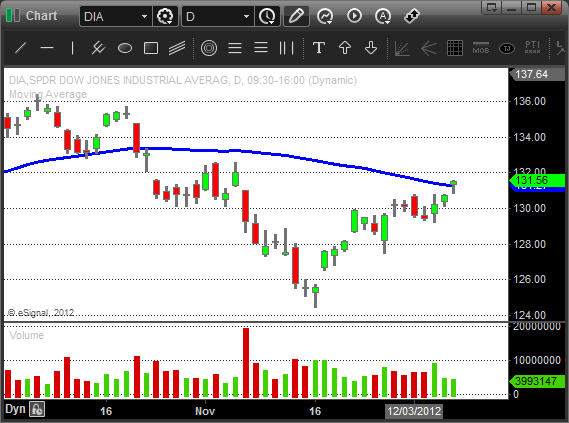
$DIA - Swing Trading

After starting the week on the down side both the DJIA and the S&P turned around on Wednesday.

Both indices finished the week with two days of modest gains.

The NASDAQ lagged behind a bit despite a few bright spots in the tech sector.

This latest move puts some of the sector ETF's back above their 50 day SMA's and has all three major indices trading right at theirs.

For short term traders that focus on price action and volume the move that happened on Wednesday was a good indication that the UP momentum would continue.

The DJIA was the best indicator of things to come.

The early morning sell off quickly turned into a reversal which had the short sellers covering their positions once again by days end.

This day formed a bullish engulfing bar in the DJIA with impressive volume to boot.

Once this continuation pattern was evident it was a good chance to look to the LONG side for some short term trades.

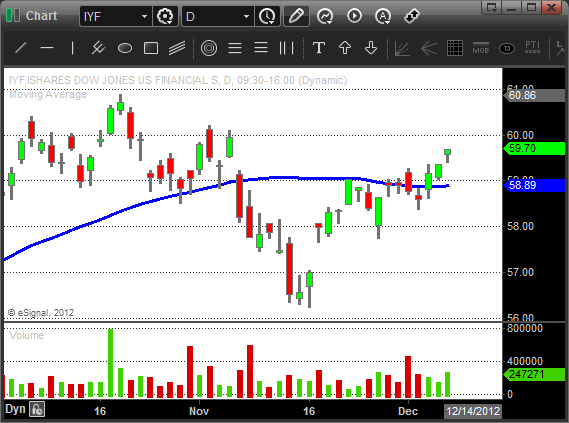
If you trade the ETF's then $XLF, $IYF and $SMH had good chart patterns to trade.

$IYF - Swing Trading ETF

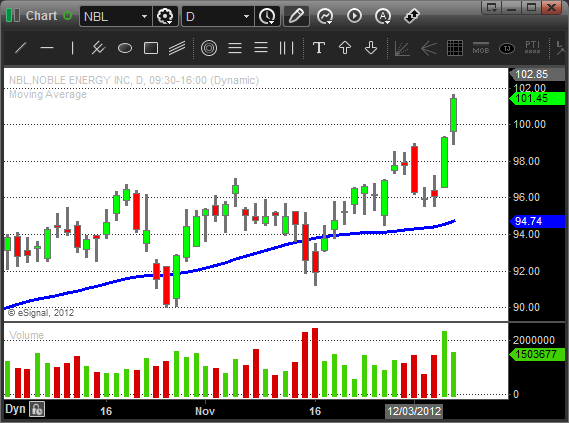
If you were looking for individual stocks then $APC, $$NBL, $ARG, and $VAR were on the radar.

$NBL - Swing Trading Trades

Just remember that we are in SHORT TERM trade mode.

Quick trades…get in and get out. We are not holding our positions with the long term outlook in mind.

We have a lot to consider as we move into trading next week.

There is still significant overhead resistance to contend with.

The NASDAQ is not really participating with much conviction in these UP moves.

Just some food for thought!

Don't try to outguess the market.

Let price and volume tell the story and act accordingly.

Until next week…Good Trading to YOU!

© Swing Trading Boot Camp 2024