Archive for the ‘Swing Trading Charts’ Category

As a Swing Trader, how did you handle today’s historic sell off?

Thursday, May 6th, 2010

How did you handle the historic sell off in the market today?

Today the Dow Jones Industrial Average dropped nearly 1,000 points before rallying back by the end of the day to finish down a mere 347.80 points.
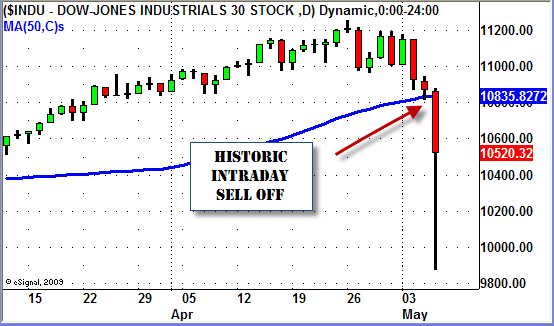
Dow Jones Sell Off May 6, 2010

News is coming out now about a "trading mistake" made by a "large trading firm" being the culprit for the sell off.

More importantly though is how you, as a swing trader, handled today's extreme volatility.

If you were LONG any positions did you follow your trading plan and EXIT when price hit your STOP (Initial or trailing) level?

If you were SHORT did you follow your plan and COVER when price hit your profit target?

Did you see the sell off and just "hold on" and hope for the best?

Or did you hang on for the entire down move only to see some quick profits evaporate because everything happened so fast?

And on top of that, since you held most or all of your position, you are worried about what the market will do tomorrow since this sell off may have been an "error".

If the last 3 sentences describe how you handled today's market and your current  situation then I would venture to say that you probably don't have a trading plan in place.

And if you do have a "plan" then you either did not follow your rules OR your trading plan needs updating and/or more specific rules.

Now if you have a longer term outlook than the average Swing Trader (2-5 days) then this may NOT apply to you.

On the other hand if you are a short term trader than today's continuation move down gave you ample opportunity to take your profits and even trail the rest (if your strategy calls for scaling out of a position).

Let me give you an example using a trade we initiated last week.

After one successful trade early in the week we alerted our newsletter subscribers last Friday of another LONG trade setup in the Inverse Financial ETF (FAZ).

We have been watching this sector closely since the negative news about Goldman Sachs (GS) came out.

After entering into the trade at $12.01 we set our initial STOP LOSS level at $11.23 which is just over 1 ATR from our entry.
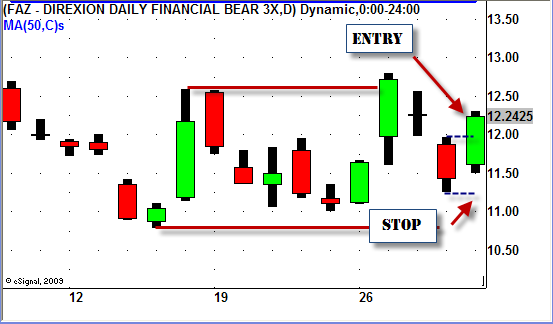
FAZ - Swing Trading ETF

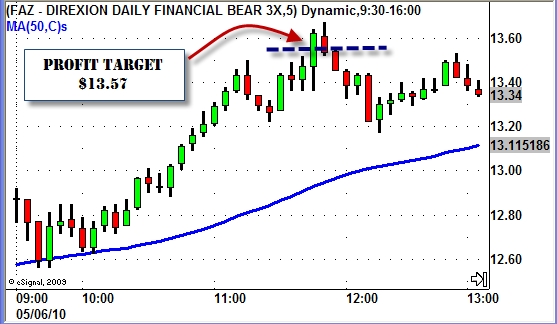
Our initial PROFIT TARGET was set to $13.57, 2 ATR's, above our entry price.

As of this morning we were still in our trade so lets describe how the day played out.

Just before noon today FAZ hit our profit target at $13.57.
FAZ - Swing Trading ETF

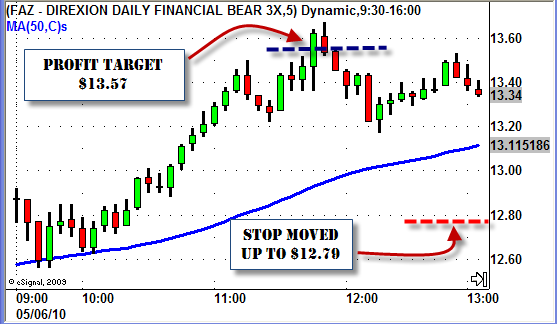
For this specific strategy our plan was to sell half of our position at the PROFIT TARGET and use a trailing stop, set to 1 ATR below the current price, for the remainder of our shares.

We followed our plan and exited half of our position at $13.57 and moved our STOP up to $12.79 (13.57 minus .78 which is 1 ATR).
FAZ - Inverse ETF

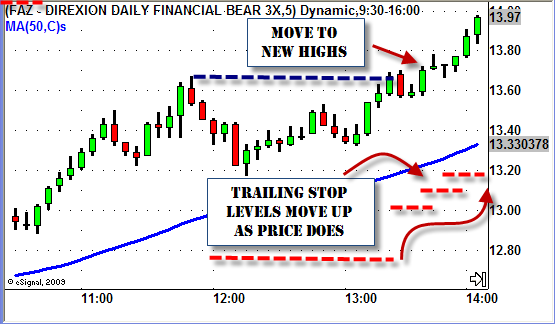
After consolidating for over an hour FAZ started to take off at started to make new highs around 1:45pm.

As FAZ continued to rally all the way up to $15.97 we held tight and followed our plan by moving our trailing stop UP as price increased.
FAZ - Swing Trading ETF

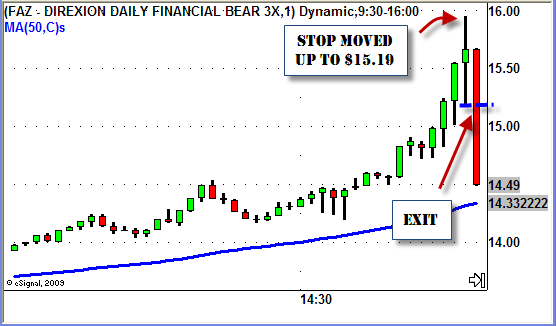
We trailed our stop by 1 ATR all the way up and ultimately set our final stop at $15.19 (15.97 – .78).

When the market started to bounce and FAZ turned south it happened FAST.

Here is a look at the 1 minute chart so you can see the move.
FAZ - Swing Trading ETF

FAZ fell almost $1.50 in ONE MINUTE!

FAZ eventually came all the way back down to $13.93, more than $2 off the days high!

That is a lot of profit to give back.

Had we not quickly implemented the plan we had in place we would have given back a large portion of our profits very quickly.

If you are serious about trading (and your money) create a detailed trading plan that specifically lays out what you will do in each and every situation the market throws at you.

Having a set of rules in place (and following them) not only leads to less stressful trading but can also help you hold onto some of your hard earned profits!



Swing Trading Chart Patterns – Head and Shoulders

Tuesday, May 4th, 2010

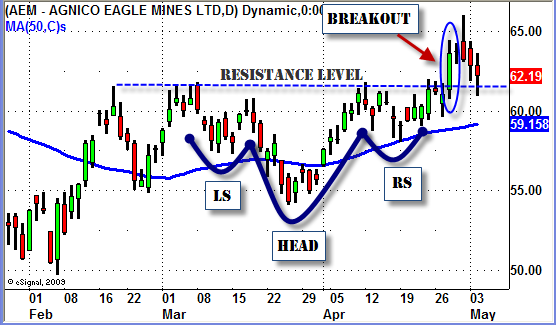
Swing Trading Chart Pattern - Head and Shoulders

With GOLD and the GOLD MINERS ETF's showing recent relative strength we have a few of the stocks, including AEM, on our watch list.

You can see on the chart above how AEM has broken out of an "inverted" Head and shoulders pattern which began to form nearly two months ago.

The overhead resistance was clear in the $61.50 to $62 price level.

So now that AEM has pulled back from its recent high we will look for confirming price action to see if the previous resistance area will now become a new support level.

If the UP move in AEM continues the next possible resistance level would be in the $68.50 area.

Swing Trading Week in Review – April 30, 2010

Saturday, May 1st, 2010

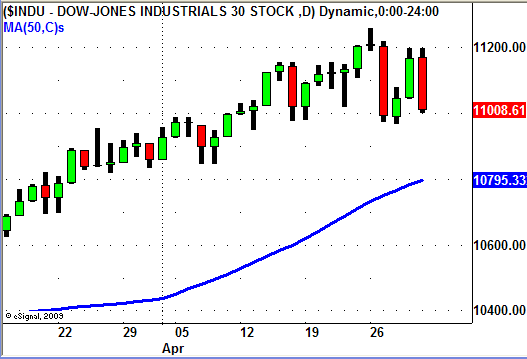
After making NEW YEARLY HIGHS on Monday the market finished down almost 1.8% this week.

Sellers came out in force on Tuesday but the market quickly rebounded Wednesday and Thursday.

The low volume "rebound" came to end on Friday as sellers stepped in again creating a sell off that drove the market down right until the closing bell.

Dow Jones Index 4/30/10

As far as individual sectors go, the Financial ETF's (XLF, IAI, IYF), all made another move lower this week.

We have been watching this sector closely since the negative news came out about Goldman Sachs.

Last week we noticed, and posted to our blog, that the Financial ETF's were not showing much strength as the market made its move up on Thursday and Friday.

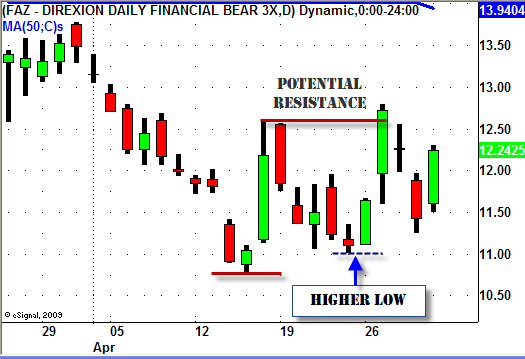
The follow through to the down side started on Monday allowing us go LONG the Inverse Financial ETF (FAZ) for a nice short term swing trade.

FAZ - Swing Trading ETF

After hitting resistance at the short term double top FAZ pulled back a bit and continued its UP move on Friday.

Another sector we have been watching closely is the Steel sector.

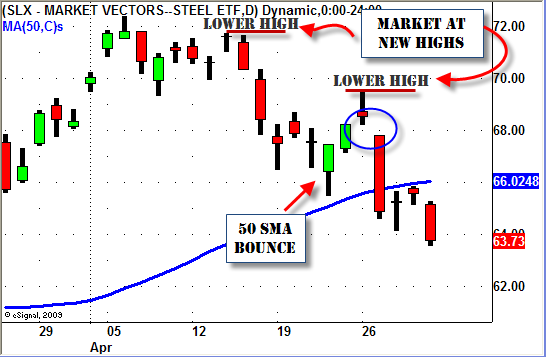
We began to notice the Steel ETF (SLX) was possibly running out of steam during the market move to new highs on April 14th and 15th.

SLX never made it to new highs as the market rallied and actually begin to sell off as the market made its new high on the 15th.

The weakness continued last week and as the market again rallied to NEW HIGHS by Friday, SLX made an unimpressive bounce off of the 50 Day SMA.

When the sellers stepped in on Tuesday this week SLX sold off right out of the gate and never looked back.

The "Gap Down and Go" as we call it created a "lower high" and was a good opportunity for a SHORT Swing Trade in this sector.

SLX - Swing Trading ETF

So what do we do going into next week?

With the market putting in its first significant "lower high" this week we will continue to look for signs of follow through to the down side.

As always though we will continue to look for opportunities on both the LONG and SHORT side of the market just in case the market finds its legs again and makes a run back towards the highs.

Just remember that being prepared for ANYTHING and EVERYTHING increases your chances of trading success.

Until next week…Good trading to YOU!

Swing Trading Week in Review – April 23, 2010

Friday, April 23rd, 2010

NEW HIGHS…YET AGAIN!

Last Friday when the news came out about Goldman Sachs a lot of traders (including us) started to wonder if the market would finally pullback after a bit of negative news.

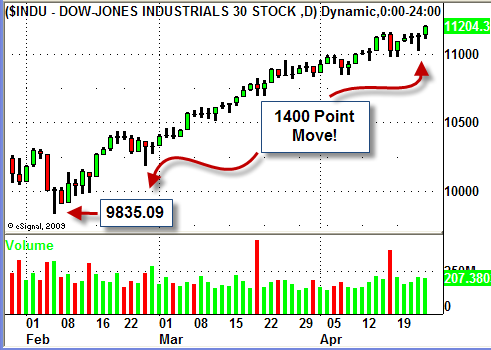
Well this week the market spoke LOUD and CLEAR by finishing a strong week at NEW HIGHS for the year.

That makes this an almost 1400 point rally since "that reversal day" which happened on February 5th.

DJIA 1400 Point Rally

As far as individual sectors go the FInancial ETF's (XLF, IYF, IAI) all had a strong week but DID NOT make news highs with the market.

The Semiconductors ETF (SMH), which broke out last week, had a lackluster week but we will continue to watch for follow through to the upside.

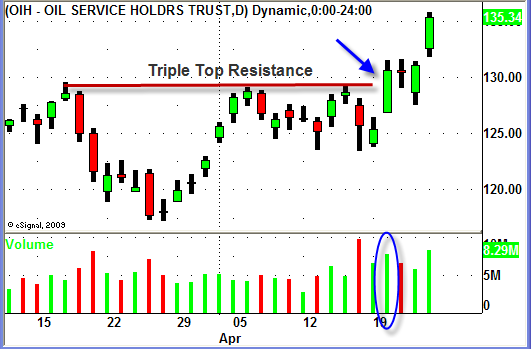
The Oil services (OIH) and Energy ETF's (XLE) finally broke to the upside this week.

OIH ETF - Swing Trading Break Out

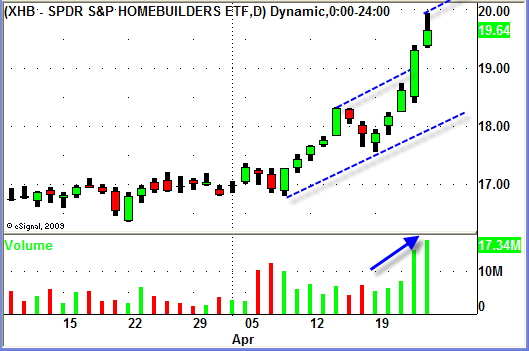
A few weeks ago in this blog we posted about the relative strength we were seeing in the Homebuilders ETF (XHB).

This week XHB setup another very nice swing trade opportunity.

We posted the details about the trade HERE but lets look at the chart.

XHB - ETF Swing Trade

With the market being this strong there were a TON of individual names that were UP strong this week.

The Retail sector was particularly strong with stocks like JWN, SKS, TIF and several others having a great week.

So will the incredible strength in these sectors and the overall market continue as we move into next week?

Of course no one knows for so just continue to listen to the market and position yourself accordingly.

DO NOT get complacent and let your guard down.

Follow your plan and your trading rules and be prepared for ANYTHING.

Until next week…Good Trading to YOU!

© Swing Trading Boot Camp 2025