Swing Trading BLOG – Swing Trading Boot Camp
And the Weekly Chart…
Sectors
and the $XLE
Swing Trading BLOG – Swing Trading Boot Camp

And the Weekly Chart…

Sectors

and the $XLE

Swing Trading Blog – Swing Trading Boot Camp
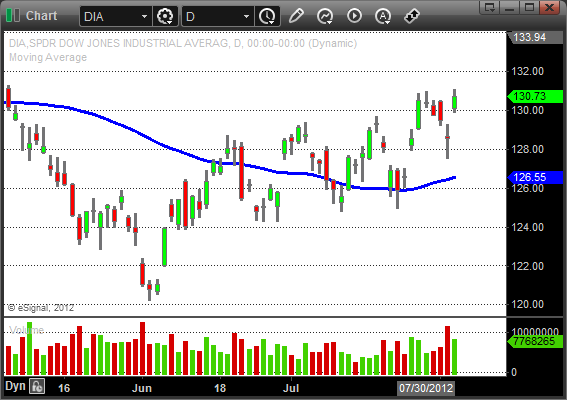
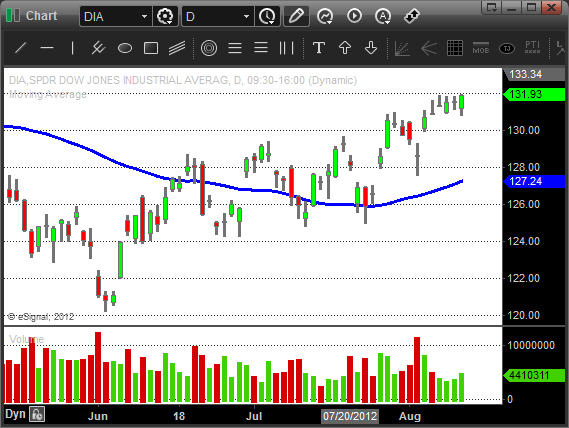
After a strong up move last week swing traders watched as the market pulled back for four consecutive days to start this week.
Fridays price action however confirms that we are still in a bullish trend.
The big GAP UP had traders scrambling to get LONG again and might have caught a few traders short.
The most recent move is technically another higher high in all three major indices.
The volume patterns indicated some heavy selling last week so lets see if the buying volume confirms this move to new highs.
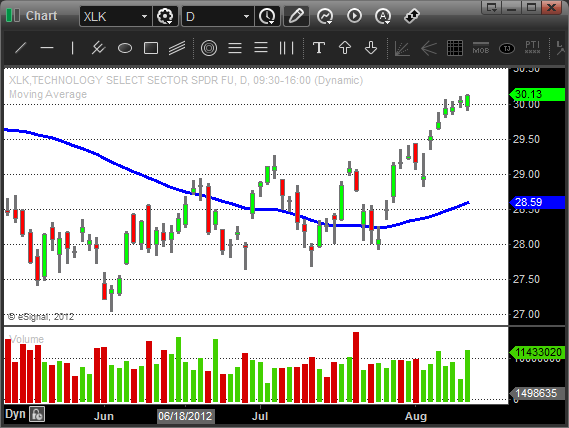
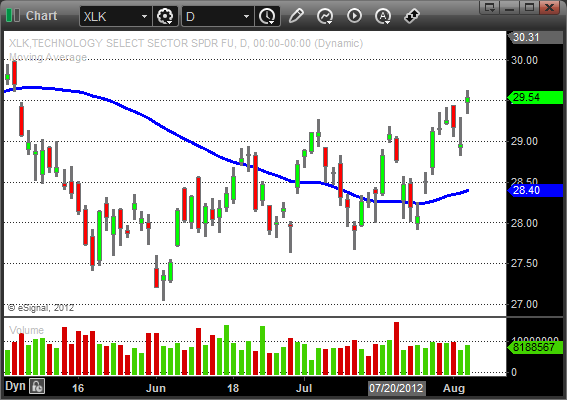
The sector action remains consistent with the strong sectors getting stronger and showing signs of moving higher.
Retail, Technology, Financials, and the Energy and Oil sector ETF's had some good chart patterns to trade.
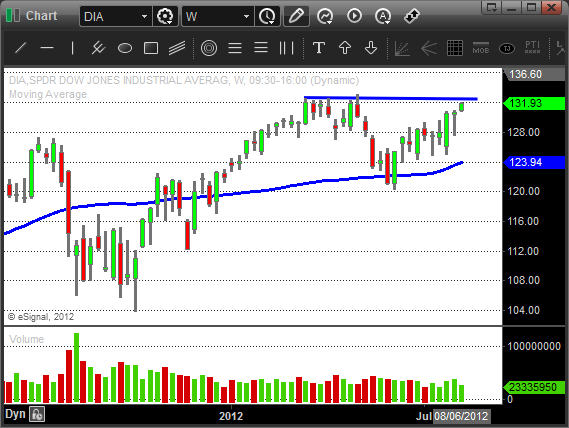
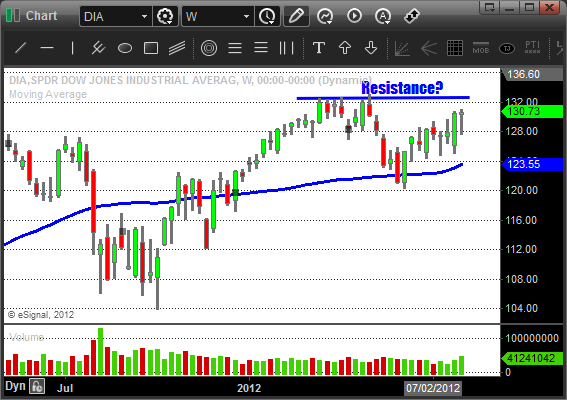
As we move into next week just be aware that we still have some substantial overhead resistance to contend with.
All three major indices put in the yearly highs in early April and then failed to move higher after that.
Here is a look at the weekly chart of the $DIA…
Look for the strongest stocks with the best chart patterns to trade.
Pay attention to price action and volume if we make a run to the April highs.
Have a plan for whatever the market decides to do from here.
Until next week…Good Trading to YOU!
Swing Trading BLOG – Swing Trading BOOT CAMP
And off we go!
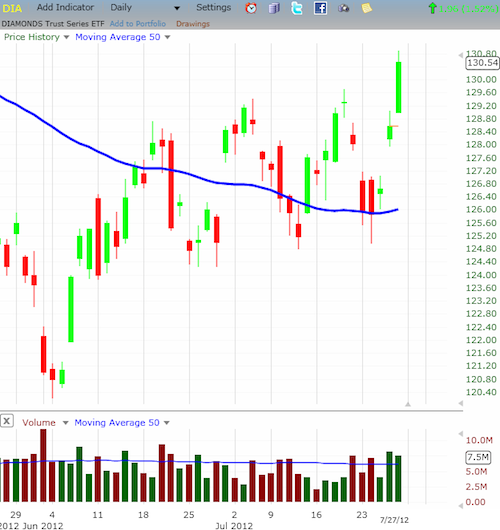
Traders watched as the recently stop and go market finally got up and went.
After weeks of indecision (with a bullish skew) the markets finally picked a direction in a big way this week.
The most recent pullback brought the market back (once again) to their 50 day moving average to start the week.
After finding some support there the market once again found its footing and moved back up on Thursday.
Friday traders watched as the markets GAPPED UP and finally broke out above there short term overhead resistance levels.
The chart pattern was sound.
The support at the 50 day SMA. Confirmation of a higher low on Thursday. Continuation and BREAKOUT on Friday.
The UP TREND continues!
As a swing trader you have to recognize these chart patterns and take action when they present themselves.
Although the overall market has been a bit chaotic you should have had some on the strong stocks and ETF's on your Watch List.
Once you noticed the potential of the market finding support around the 50 day you had to start thinking about the LONG side of the market.
ETF's that have been STRONGER than the overall market and a good place to start.
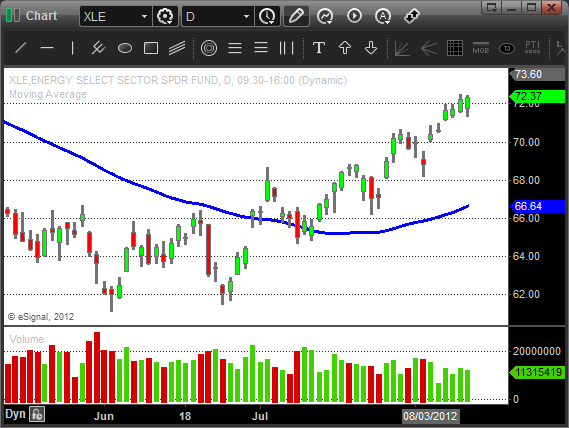
Take a look at the Oil and Energy ETF's ($XLE $OIH).
Stronger than the market and great chart patterns to trade.
Look at the charts. Study them. Take a look at the price action and volume. Damn near perfect patterns to trade.
Drill down to find some stocks in those sectors and you find the same thing.
$MRO and $SUN had some nice follow through after pretty text book setups.
Once again price action and volume paint a very clear picture.
The Retail sector ($RTH) also broke out to NEW HIGHS this week.
We have been talking about $WMT for weeks and this week had yet another opportunity for a profitable swing trade.
There are still plenty of "lagging" sectors but if the market continues to strengthen you might look for clues that these sectors are turning.
This most recent move in the market brings us back up to a level that will obviously entice some sellers.
Don't be afraid that you will miss the bus if you are looking to get long.
Let the trades come to you and take action once they do.
Pay close attention to the clues (price action and volume) that the market gives you and be prepared for anything.
Next week should be fun!
Until then…Good Trading to YOU!
Swing Trading BLOG – Swing Trading BOOT CAMP
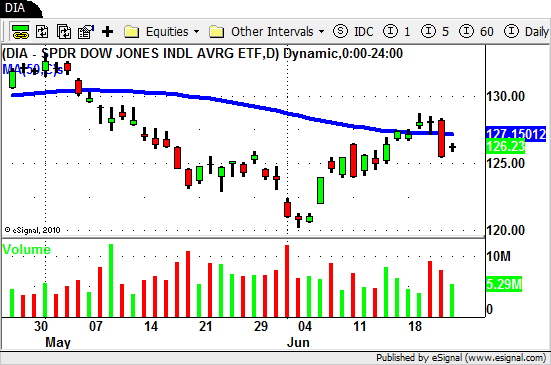
The markets continued to drift upwards (on low volume) to start out the week bringing the DJIA just above its 50 day SMA.
Wednesday was a different story as the news the market was waiting for finally came out.
The sellers showed up in a big way in the afternoon and followed up on Thursday with a day full of selling pressure.
Friday we watched as the market traded sideways creating a low volume "inside day".
Last week we told you that "One side will win the "tug of war" and you will miss the moves if you aren't ready."
Once the news came out you had to expect a dramatic move one way or the another.
Being prepared for anything (as we say over and over and over) is a key to becoming a successful trader.
If you had a SHORT list prepared then I am sure your triggers were hit either late Wednesday or sometime on Thursday.
With plenty of weak stocks out there I am sure you had plenty of options.
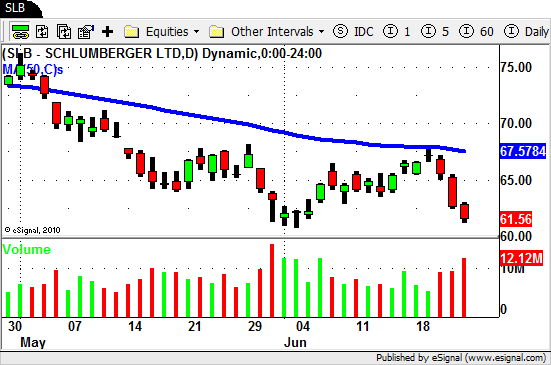
The Energy, Oil, and Oil Services sectors have been extremely weak so that was a natural choice.
$SLB $HES and $HAL had great chart patterns to trade…
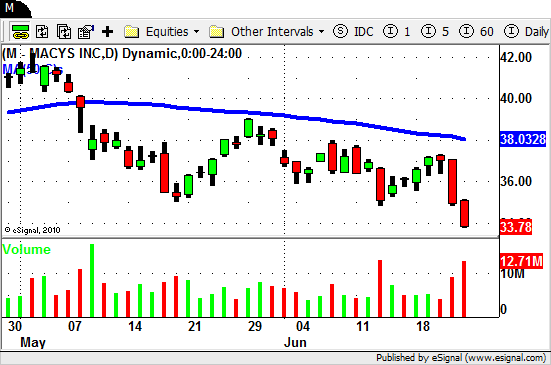
Some of the Retail stocks ($M $BBBY $RL ) also got smacked around despite the strength the overall sector is showing.
Despite all the doom and gloom talk there are actually (for now) still stocks showing a tremendous amount of strength.
The sectors vary but take a look at the charts for $VZ $CRUS $LLY $ASH $V $MMR and $WFM.
So what is trader to do from here?
Go LONG the strong stocks? Or go SHORT the weak stocks?
As always it depends on your personal strategy but when the overall market is hoovering near its 50 day SMA we tend to play both sides of the market.
For our STS trades we will SHORT the weakest of the weak and BUY the strongest of the strong and leave everything else alone.
We are looking for SHORT TERM moves here…we are NOT position traders.
Often times one side will STOP US OUT when the market does make a definitive move but that is a good thing for us.
We then have more conviction and can look for more trades that are now going in the direction of the market.
Don't be afraid to make trades and to get stooped out….it's a big part of trading and it happens often.
Next week the market should give us additional clues to it's "true" direction so, as always, be prepared for anything (heard that before?).
Listen to the market and act accordingly.
Make your entries, set and honor your stops, take your profits. Rinse and repeat.
Until next week…Good Trading to YOU!
© Swing Trading Boot Camp 2024