Archive for the ‘Swing Trading Blog’ Category

Swing Trading Week in Review – November 16, 2012

Sunday, November 18th, 2012

Swing Trading BLOG – Swing Trading BOOT CAMP
$DIA - Swing Trading ETF

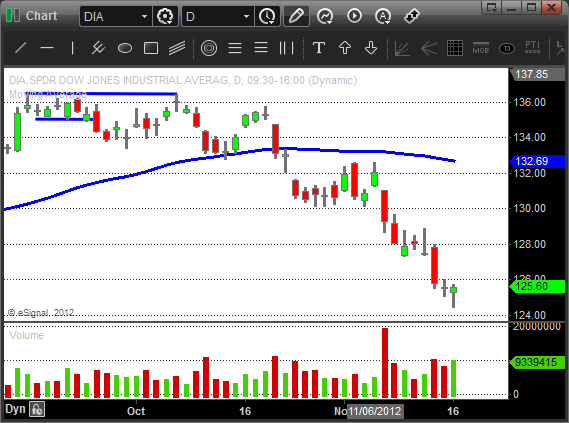
The SELL OFF continues!

The markets opened up on Monday with traders anticipating the selling was (hopefully) coming to end.

Mondays lack of volatility was quickly followed by a bearish engulfing reversal bar on Tuesday.

The sellers then continued to bring the market lower to end yet another down week in this most recent downtrend.

This move brings the major indices down to a severely oversold level so a "bounce" next week is a probable.

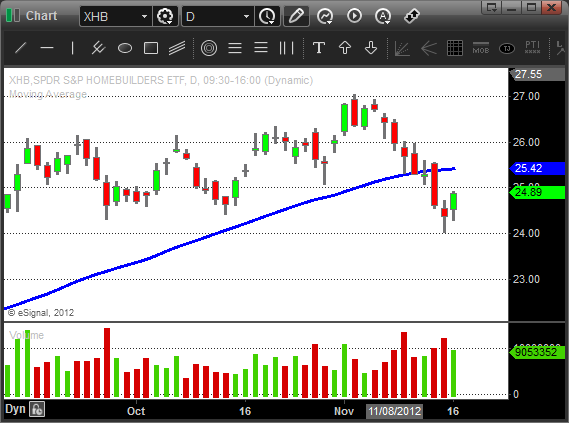
Looking across the list of sector ETF's we see now that every major sector is trading below the 50 day SMA.

This includes the ultra strong Homebuilders ETF ($XHB) which finally broke down this week.
$XHB - Swing Trading ETF

So with the market turning extremely bearish and the chance of a "bounce" this week what is trader to do?

Well it really depends on your trading business plan.

Does your business plan keep you out of LONG trades in a BEARISH market?

Or does your plan let you trade both LONG and SHORT regardless of the trend?

Your plan should be based around your individual trading beliefs and personality so make sure you take the time to lay out your plan.

With that being said we need to decide which action (if any) we will take if we do see the market "bounce" next week.

If the market does indeed bounce we anticipate being out of most if not all of our STS trades.

We would not look to get LONG but merely let the market play out a reevaluate once the retrace was in effect.

We also would not look to add any more SHORTS at this point even if the market continued lower out of the gate on Monday.

Chasing the market down at this point has low probability of success.

We will continue to be in SHORT mode until the market gives of signs of change.

There is a short list of stocks ($K, $V, $CREE and $FB looks interesting!) that are holding up during this down trend.

As always we will have these on our watch list to see if the strength continues.

Follow your plan and stay on the right side of the market.

Until next week…Good trading to YOU!

Swing Trading Week in Review – November 2, 2012

Sunday, November 4th, 2012

Swing Trading BLOG – Swing Trading BOOT CAMP

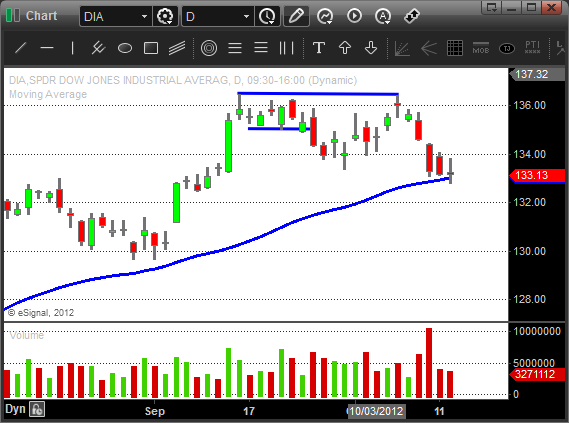
$DIA - Swing Trading ETF

**Our thoughts and prayers go out to the victims of Hurricane Sandy**

After a historic decision to close the US Stock Markets both Monday and Tuesday we opened up on Wednesday with a bit of uncertainty.

Low volume was the theme even as the market popped a little on Thursday.

Friday brought out the sellers again and starts what appears to be the next leg down in this recent down trend.

If you at the charts you can see that volume increased and the bearish engulfing bars created on the three major indices are down right bearish.

The one bright spot this week?

The Homebuilders ($XHB) actually traded to a NEW HIGH despite the overall bearish conditions.

That is about as good as it gets since almost every other sector sold off with the market.

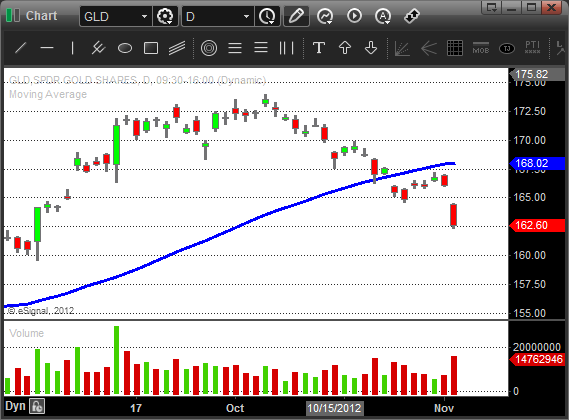
A few weeks back we mentioned that the Gold and Silver sector ETF's were losing steam.

Friday both sectors got hammered!

$GLD - Gold Sector ETF

The technology sector and the tech heavy NASDAQ have been the worst performers with no end in sight.

The Energy and Oil sectors look like they are heading lower.

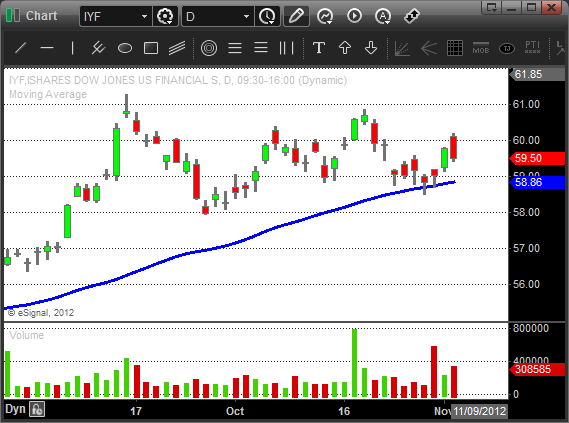
The chart of the Financial ETFs look interesting.

$IYF - Swing Trading ETF

Will this lower high lead to a head and shoulders pattern on the charts?

Time will tell but learning to spot patterns as they form is a key to trading price action.

Next week should be a big week in the market and you should expect some volatility.

Have a plan in place and trade it accordingly.

Keep the victims of Hurricane Sandy in your thoughts and prayers and as always…Good Trading to YOU!

Swing Trading Week in Review – October 19, 2012

Sunday, October 21st, 2012

Swing Trading BLOG – Swing Trading BOOT CAMP

And DOOOOOOOWN we go…

This week traders watch the market roll over and finish out the week with DJIA dropping over 200 points.

After a bit of a retrace to start the week the NASDAQ got rocked again!

I'm sure the earning news from Google ($GOOG) didn't help matters at all.

The chart of the NASDAQ is a classic chart pattern that shows the relative weakness we were looking at.

Thursday price action and volume confirmed the next move lower and let us draw our new accelerated trend line.

On the flip side a few sectors actually did quite well this week.

The Homebuilders ($XHB) actually traded to a NEW HIGH this and  the Financials ($XLF) popped nicely early in the week.

The Energy and Oil sectors ($XLE $OIH) broke out of consolidation this week but were also met with a big day of selling on Friday.

The Tech sector (including the Semi's) continued to get whacked this week.

Both $XLK and $SMH traded to new multi month lows on Friday.

Gold ($GLD) and Silver ($SLV) continue to sell off after putting in a telltale "lower high" last week.

The amount of SHORT setups we saw this week were a good indication that the market was turning.

$AAPL was a pretty text book short.

The interesting thing here is that despite the hard sell off we saw this week there are still loads of stocks holding up.

This relative strength keeps us looking at both sides of the market for trade opportunities.

If the Dow and S&P follow the NASDAQs lead we will see how these stocks handle the heat.

Another sell off that brings these two indices below their 50 day SMA's would have us focusing mostly on the SHORT side but until then we will actively look at both sides of the market.

Will the market follow through to the DOWN side of find some support this week?

No one know for sure so be prepared for either option.

Until next week…Good Trading to YOU!

Swing Trading Week in Review – October 12, 2012

Sunday, October 14th, 2012

Swing Trading BLOG – Swing Trading BOOT CAMP

$DIA - Swing Trading ETF

After returning to the recent high last week swing traders watched as the Dow Jones Industrial Average sold off this week.

Right from the opening bell on Monday the sellers came out in a big way.

By weeks end the selling pressure had us looking at one of the worst weeks since the summer.

This did NOT happen without warning though.

Last week we pointed out the some of the recently strong sectors were showing signs of "losing steam".

The Tech sector had stalled causing the tech heavy NASDAQ to stall right along with it.

We said that we would need confirmation to validate a move higher or lower and that the NASADAQ could be a catalyst.

This week we watched the confirmation come almost from the get go on Monday.

The GAP DOWN had us looking to the SHORT SIDE by days end.

This was the price action clue that we were looking for.

The move lower on Tuesday on increased volume was all we needed to know that the next move lower was upon us.

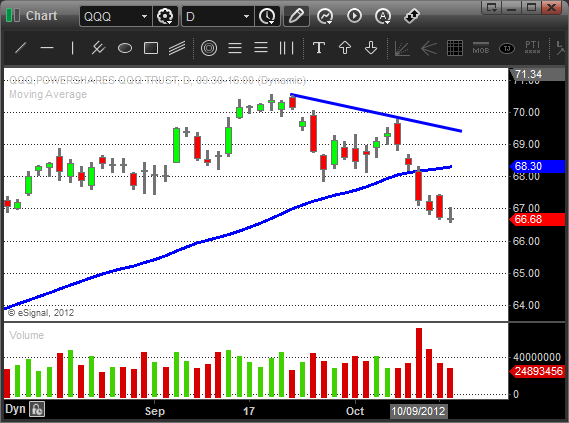
Here is the chart of the QQQ

$QQQ - Swing Trading ETF

The transition from bullish to bearish that we saw this week brings the market back down near the 50 day EMA.

The DJIA and S&P and basically hugging the 50 day while the weaker NASDAQ has now traded below it.

This latest move has people wondering a bigger sell off isnt right around the corner.

There are some sectors still showing strength.

The Financials and Homebuilders are (as of now) holding up.

The Energy and Oil ($XLE $OIH) sectors are trading sideways despite the market pushing lower.

Look for a breakout (or breakdown)in these two sectors in the near future.

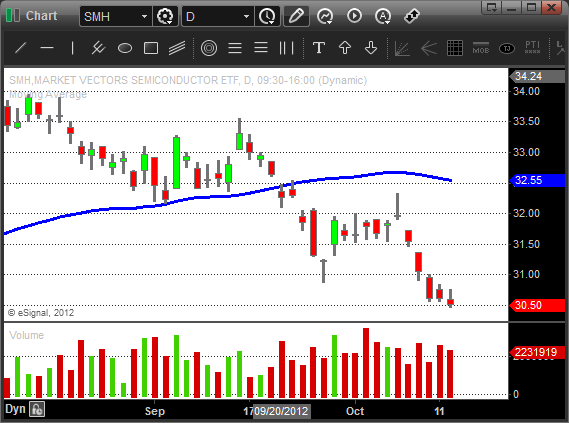
One weak sector we mentioned a few weeks ago was the Semiconductors ($SMH).

$SMH - Short Swing Trading

Notice the relative weakness prior to the sell off this week.

A good place to look for SHORTS wouldn't you say?

Gold and Silver ($GLD $SLV) are holding up BUT…

After last weeks down move the market and a few of these sectors are in short term oversold territory.

We could see the buyers step in here very soon to protect their long positions.

The SHORTS may also look to cover and take some profits.

All that being said expect a stall or even a bit of a bounce.

Now that we have seem some weakness in the market it is important to have a complete watch list.

Look through the charts and put together a list of stocks that are weaker than the market.

Put those with the best chart patterns on your SHORT watch list.

Look for stocks that are holding up well doing this recent down move.

Put those with the best patterns on your LONG list.

Once the market lets you know where it is headed next take the appropriate action.

Until next week…Good Trading to YOU!

© Swing Trading Boot Camp 2024