Archive for the ‘Swing Trading Blog’ Category

Swing Trading BLOG – Week in Review – June 3, 2011

Sunday, June 5th, 2011

Swing Trading BLOG – Swing Trading BOOT CAMP

DIA - Swing Trading ETF

The DOWN move continues!

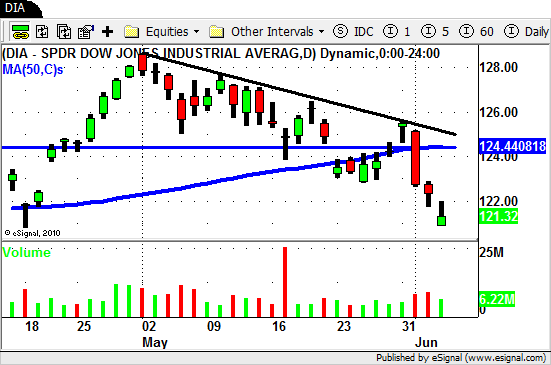
After one day of trading above its 50 day SMA the DJIA sold off for the rest of the holiday shorted week.

The push lower takes the markets to a new six week low.

Most (not all) sectors followed suit as the sellers came out in force.

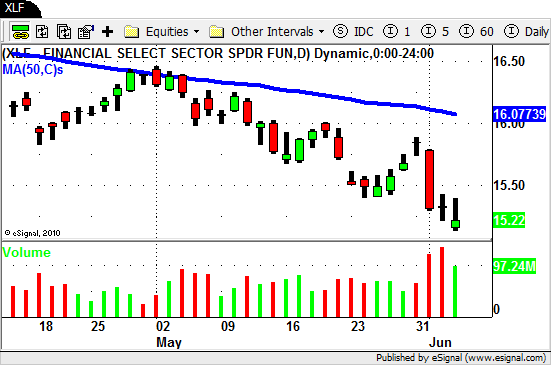
The Financials ($XLF) and the Homebuilders ($XHB) were hit hard.

XLF - Swing Trading ETF

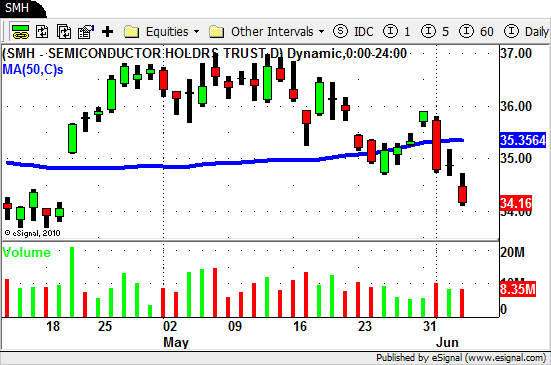
Technology ($XLK) and more specifically the Semiconductors ($SMH) also had a rough week.

SMH - Swing Trading ETF

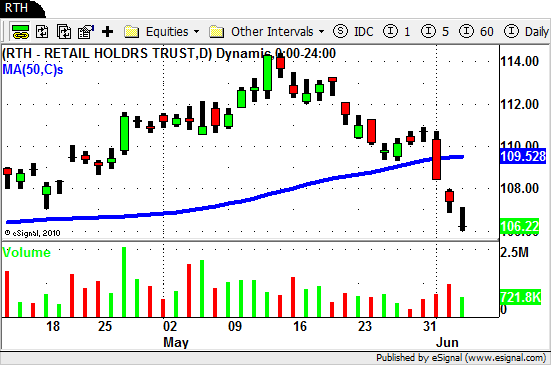
Retail ($RTH) was holding up but finally gave way to the selling this week as well.

RTH - Swing Trading ETF

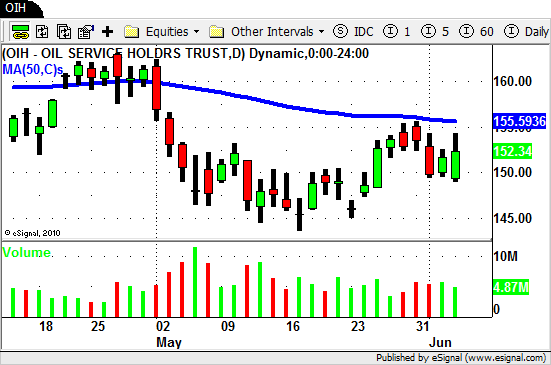
The Energy ($XLE) and Oil ($OIH) ETF's actually held up rather well this week.

OIH - Swing Trading ETF

Who knows if this SHORT TERM relative will hold up but it is something to watch as we move forward from here.

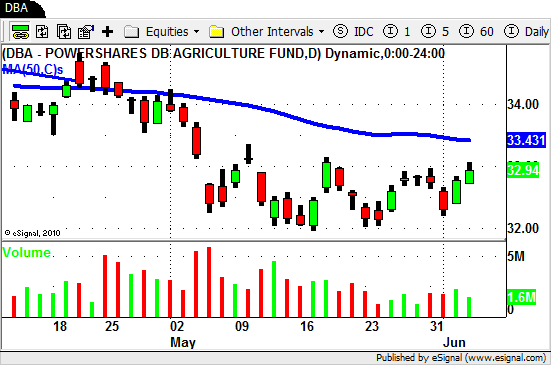
The Agriculture ETF's ($DBA $MOO) also are showing some signs of strength.

DBA - Swing Trading ETF

The overall market is pretty near a SHORT TERM oversold level so keep that in mind as we go into next week.

Don't chase the market down and wait for your setups to develop.

Be prepared for whatever the market does from here and as always…Good Trading to YOU!

Swing Trading BLOG – Week in Review – May 27, 2011

Monday, May 30th, 2011

Swing Trading BLOG – Swing Trading BOOT CAMP

DIA - Swing Trading ETF

The BIG GAP DOWN we saw on Monday extended the month long correction we have seen in the overall market.

The market is now hoovering near it's 50 day SMA as we saw a bit of a rebound by weeks end.

As we look over our sector ETF LIST it is a mixed bag.

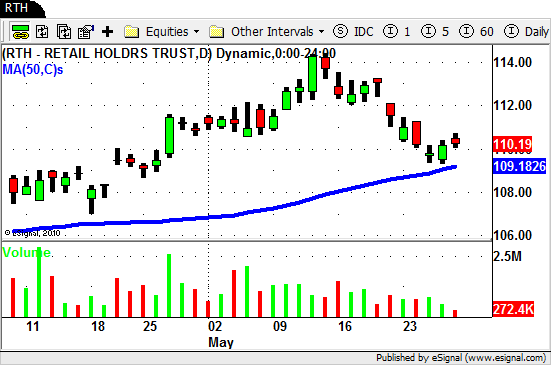
The Retail ETF ($RTH) has pulled back off of it recent high and is still trading above its 50 day SMA.

$RTH - Swing Trading ETF

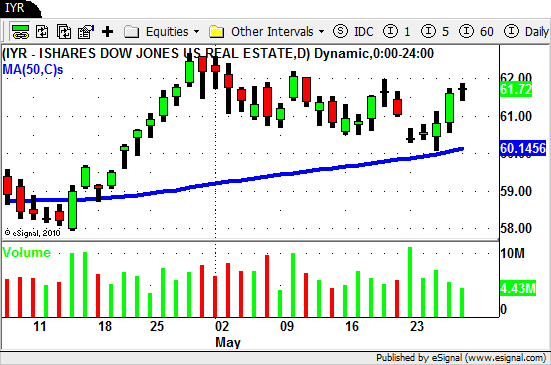
The Real Estate ETF ($IYR) is equally as strong in the short term.

$IYR - Swing Trading ETF

The oversold  Steel, Energy, and Oil ETF's put in a retrace back towards their 50 day SMA's.

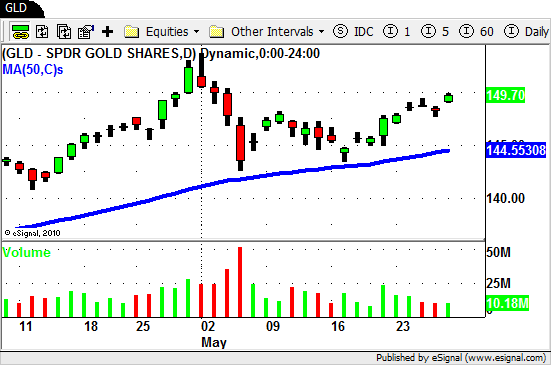
The Gold ETF ($GLD) is starting to shine again so make sure this sector is on your list.

$GLD - Swing Trading ETF

So now that we are back trading near the 50 day SMA where does the market go from here?

Do we continue the short term DOWN TREND?

Do we chop around a bit while the buyers and sellers fight it out?

No one knows for sure but for now we continue to trade both sides on the market.

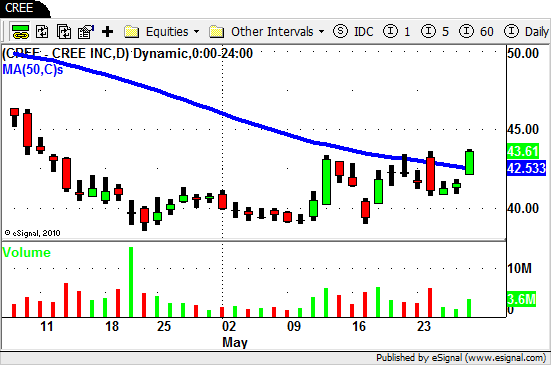
One stock that we are watching to see if it transitions from weak to strong?

Take a look at $CREE…

$CREE - Swing Trading

Keep both strong stocks ($ELN, $CTXS, $INFA, $ANF, etc) and weak ones ($SOHU, $ADSK, $HOG, $DOW) on your list and be prepared for whichever way the market goes from here.

Until next week…Good Trading to YOU!

Swing Trading BLOG – Week in Review – May 20, 2011

Sunday, May 22nd, 2011

Swing Trading BLOG – Swing Trading BOOT CAMP

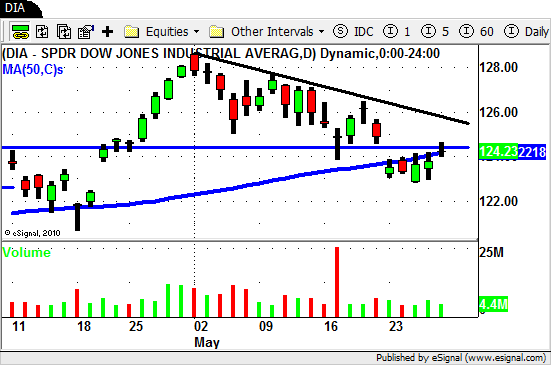
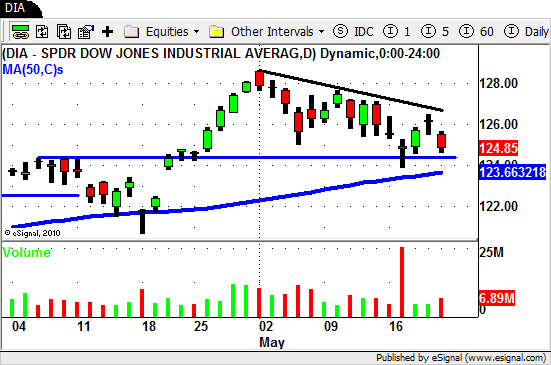
$DIA - Swing Trading ETF

After putting a LOWER HIGH last week traders watched as the market followed with a LOWER LOW this week.

Tuesdays trading actually brought the overall market down to a new low for the month of May.

The SELL OFF pushed the market back closer to its 50 day SMA and right on top of the previous break out level we saw a month ago.

This SHORT TERM correction in the market actually gives us a nice DESCENDING TRIANGLE (see chart above) to trade it we choose to do so.

A follow up on the Sector ETF's is in order so here it goes.

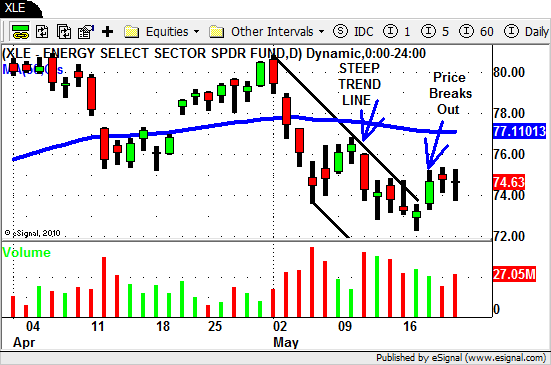
As we mentioned in last weeks BLOG POST the Energy and Oil ETF's had a very "steep" trend line in place.

These "steep" angles are hard to maintain and often times you will need to adjust your lines after price breaks out of these fast lines.

$XLE- Swing Trading ETF

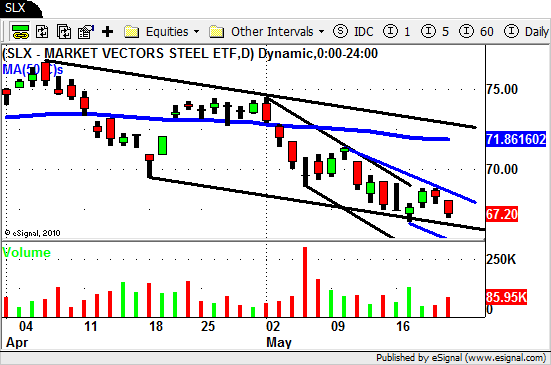
The Steel sector ETF ($SLX) is a good example of a slight TREND LINE adjustment.

In the chart below you can see how after hitting the bottom of the longer term DOWN CHANNEL $SLX "bounced" out of the SHORT TERM channel.

$SLX - Swing Trading ETF

This "bounce" actually took price out of the SHORT TERM channel BUT it was still under its previous Swing High.

Fridays trading action confirmed the next move lower so we were now able to slightly "adjust" our trend line (in blue) to gives us context for our new channel.

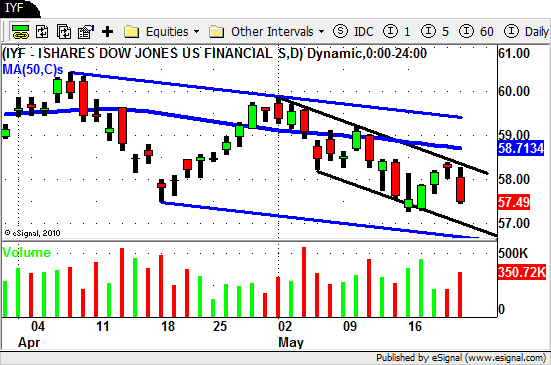
One sector that has put in a nice orderly DOWN TREND is the Financial sector ETF ($IYF).

No adjustment to this trend line…

$IYF - Swing Trading ETF

As we move into next week we must admit that the warning signs are flashing for us.

The selling we saw on Friday is concerning to say the least but that being said the market is still holding (so far) above its 50 day SMA.

We are still trading both sides of the market and will continue to do so until the market decides where to go from here.

Be prepared for anything and have a plan in place and until next week…Good Trading to YOU!!!

Swing Trading Technical Analysis – $MOS – Part 2

Wednesday, May 18th, 2011

Swing Trading Technical Analysis – Swing Trading BOOT CAMP

In this BLOG post we will continue our Technical Analysis view on $MOS.

If your missed part one you can view it HERE.
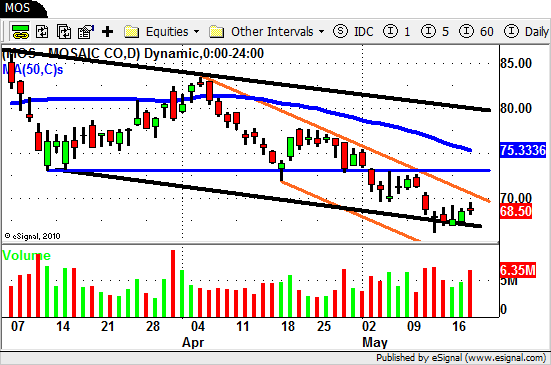
$MOS - Swing Trading Technical Analysis

We when last looked at $MOS it had just created another LOWER HIGH and was "stalling" near an area of potential support ($73).

The thick BLUE horizontal line in the chart above marks this support area.

We also posted that in order for the DOWN TREND to continue we would need to see PRICE move LOWER and VOLUME move HIGHER.

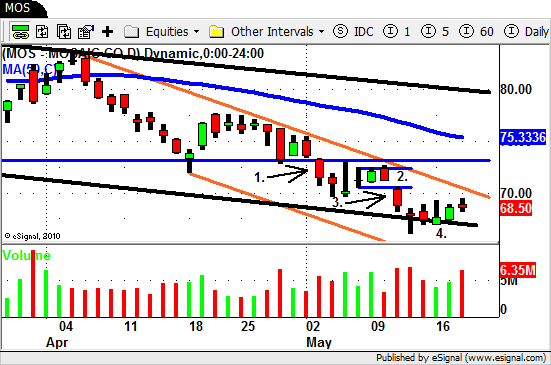
We have zoomed in a bit on the chart and annotated our comments as well.
$MOS - Technical Analysis

Two days after we posted our analysis $MOS did push LOWER ON HIGHER VOLUME confirming that the DOWN TREND was still intact.

We marked this as #1 on the chart.

$MOS quickly lost steam and two days later put in a HIGH VOLUME day but closed very near the low fo the day.

The SELLERS were still there!

$MOS continued to trade "sideways"  (#2.) until May 11th when PRICE again moved LOWER and VOLUME INCREASED (#3.)

This created another leg down in the already established DOWN CHANNEL (orange).

After another day of trading a bit lower $MOS again traded "sideways"  (#4.) until today when we watched $MOS trade above yesterdays high on increased volume.

Now even though $MOS has technically started a retrace it is still in an obvious DOWN TREND.

Notice above how $MOS is still trading inside it SHORTER TERM TREND CHANNEL (thick ORANGE LINES) as well as its LONGER TERM DOWN CHANNEL (thick BLACK LINES).

How and where you could have entered and exited a trade in $MOS depends of course on your time frame and style of trading.

As we move forward from here we apply the same logic and let price action and volume tells where $MOS is headed.

A BREAKOUT of the SHORT TERM TREND CHANNEL would NOT excite us to much at this point since there are now a bunch of resistance levels to contend with.

The LONGER TERM chart of $MOS tells us that $65 has acted a a pretty major area of support in the past.

That being said another move LOWER on HIGHER VOLUME is something we are definitely on the look out for.

If this Swing Trading Technical Analysis walk through was helpful to you please leave a comment below.
© Swing Trading Boot Camp 2025