Archive for the ‘Stock Market Update’ Category

Swing Trading Week in Review – February 12, 2010

Friday, February 12th, 2010

DOWNUPDOWNwait noUP!

Wow! What a roller coaster this week has been.

Well after last Friday's reversal day (Hammer in candlestick terms) we knew we would we in for an interesting week this week.

Would buyers step back into the market and drive it higher?

Or would the sellers regain control and push the market back down?

Well after all is said and done the market finished up a mere 87 points ( under 1%) for the WEEK.

Not very impressive!

This week the market appears to have simply put in a retrace in a longer term down trend.
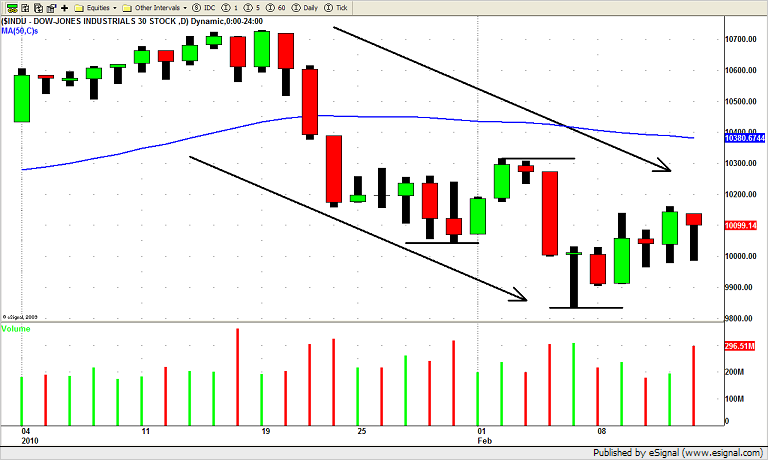
DIA Swing Trading Chart

As you see from the chart of the Diamonds (DOW ETF) we are trading well under the 50 day SMA.

We havent traded BELOW the 50 day SMA for this many days since MARCH of last year!

A bearish sign?

We believe so, but as always, we don't want to try to PREDICT what the market will do.

As Swing Traders we simply want to ANTICIPATE what it will do and hopefully take the appropriate and profitable action in time.

A few sectors ETF's, XLF (Financials), RTH (Retail), XLE (Energy), OIH (Oil Services), still look very weak in the short term.

Some sector ETF's however are showing some interesting chart patterns.

The Homebuilders ETF (XHB) is trading ABOVE its 50 day SMA and has held up quite well during the recent down move in the market.
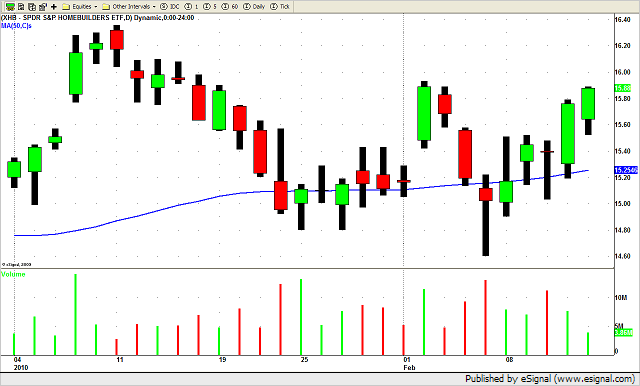
XHB Homebuilders ETF

Stocks like PHM, DHI, MTH, TOL and LEN had decent gains this week.

We aren't sure, of course, if this strength will continue in this sector but we have some small gains already "locked in" so we will trail our stops accordingly.

There has also been some individual names on our watch list that have performed quite well this week.

ASH, CMI, G, AAP and DLB have all done well while RIMM has been a rock star!

Its very hard to get aggressive to the LONG side when the market is acting the way it is.

So while we continue to have a SHORT bias we take a few LONG positions in strong stocks just in case the market continue to move up.

On the SHORT side there are a TON of charts showing potential SHORT swing trade set ups.

Regardless of what the market does next week we will be ready!

Until next week…Good trading to YOU!


Swing Trading Week in Review – February 5, 2010

Friday, February 5th, 2010

Well it has been another wild week in the market!

Monday and Tuesday saw the markets climb giving some traders and investors a sense that the market may have found some support.

Wednesday's lackluster performance was quickly followed up by another round of HIGH VOLUME SELLING on Thursday.

Fridays market action was quite volatile with selling continuing early in the day.

Buyers stepped in after lunch time and turned the market around by rallying about 160 points to end the day near break even.

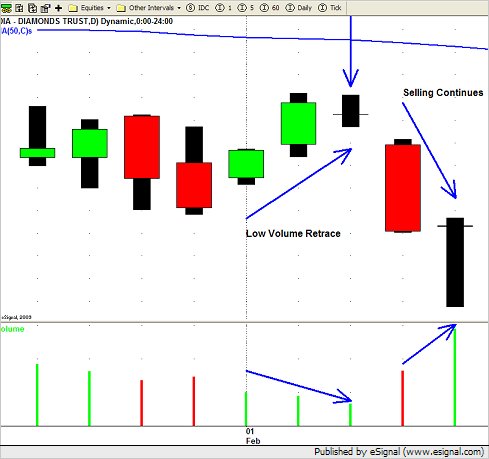
DIA (Dow ETF)

So after Friday afternoons reversal what can we expect going into next week?

As always we let the charts tell us what to do.

Last weeks price action was "picture perfect" when it came to SHORT swing trade set ups.

Monday and Tuesdays low volume up move we quickly identified as simply a retrace in a down channel.

Wednesday's inside day, again on low volume, created perfect chart patterns for SHORT SWING TRADE opportunities.

The trigger came on Thursday when the selling came back into the market after the retrace.

If you would have gotten SHORT on Thursday and managed your swing trades the right way, Friday's reversal day would NOT have been a big deal to you.

You could have covered your positions into the downward momentum on Thursday and even into Friday morning.

If you chose to only cover a portion of your positions then the worst case scenario was to move your stop down to break even (at least) on the remaining shares.

Next week's market action should be very interesting after Fridays impressive late day rally.

If you are prepared for battle (have a solid trading plan) it shouldn't matter what the market does since you are prepared for EACH and EVERY situation the market throws at you.

Until next week…Good Trading to YOU!

Swing Trading Week in Review – January 29, 2010

Friday, January 29th, 2010

And the SELL OFF continues!

Another week of selling left the DOW closing just above 10,000 on Friday and by the looks of the charts there were not many sectors immune from the downward push.

Some of the biggest hit sectors were Technology, Steel, Semiconductors, Oil Services and Energy.

The Financials, which some think will be hardest hit due to recent news, held up relatvely well this week.

This could be just a pullback before selling once again comes into the sector sending it lower.

As a swing trader it has been very hard to be LONG anything but INVERSE ETF's.

DXD, SKF,and SRS (just to name a few) have traded up nicely during the past 2 weeks and could be ready for their next move up soon.

Our swing trading newsletter, The ETF Swing Trader, has kept our subscribers informed of these recent profitable trades in these inverse ETF's.

As far as individual stocks go, the chart patterns are setting up nicely for entering into new SHORT positions.

We will continue to look for stocks that are not extended to the downside for SHORT trades.

We are long overdue for some short of pullback in this market after last years run up.

Where we go next week no one knows for sure but but fight the trend and try to out guess the market.

Analyze the PRICE ACTION and VOLUME on the charts and left the market tell you want it wants to do and simply follow along.

Good trading to you!

Swing Trading Week in Review – January 22, 2010

Friday, January 22nd, 2010

The DOW fell over 4% (over 400 points) this week closing at 10172.98.

The S&P 500 and NASDAQ followed suit also selling off around 4% each as well.

After last weeks price action (see last post) we took notice of the potential down move in the market.

When the market opened Tuesday, after being closed for the holiday on Monday, the market rallied strong and turned in a positive day closing near the highs of the day.

Traders had to think that the market could possibly be making another attempt towards the recent highs.

Our job as traders or active investors is to look for clues that the market gives to make our trading decisions.

Our clue that Tuesdays market action was a possible "fake out" was once again price action AND volume.

Even though the market had a nice up move on Tuesday the volume was light.

The volume clue was not only evident in the overall market but in the sector ETF's and individual stocks as well.

Lets look at the charts we posted last week to see how they played out.

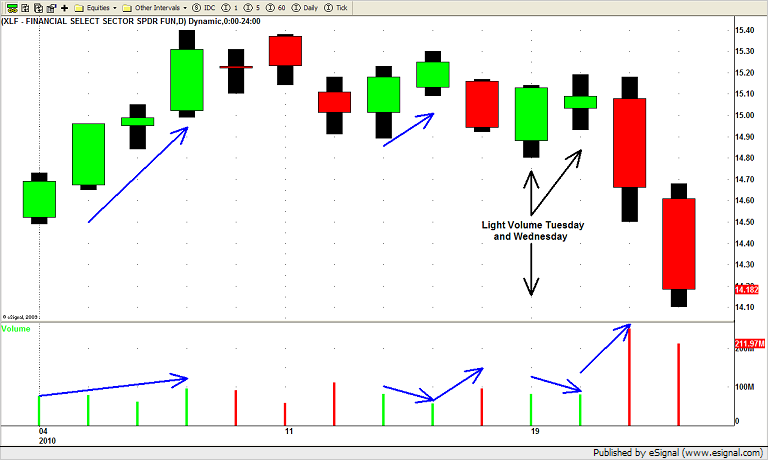
First we take at look at the XLF (Financials ETF).

XLF ETF

Tuesday's light volume reversal day as followed by a lighter volume day on Wednesday with price closing near the mid point of the day.

Price action AND volume then follow through to the DOWN side nicely on Thursday and Friday.

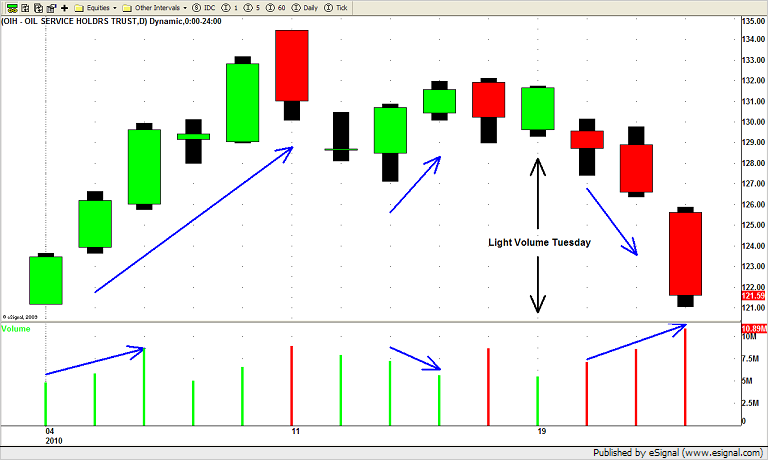
Here is the OIH (Oil Servies ETF) chart.

OIH

You can see how even though the sector had a nice up day on Tuesday the volume was light.

Wednesdays price action (down) on increasing volume confirmed that price was heading lower (even if only temporarily).

The selling accelerated on Thursday and Friday pushing price lower closing near the lows of the week.

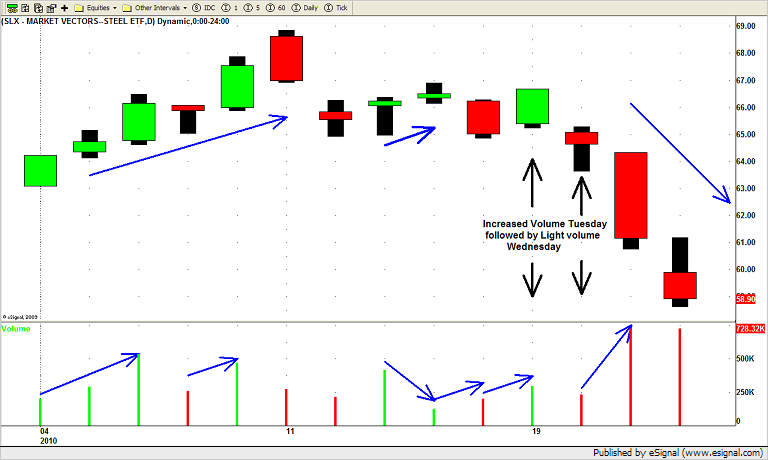
And finally lets look at the SLX (Steel ETF) chart we posted last week.

SLX ETF

This one was a little tricky for a few reasons.

The Steel sector has been on fire recently so when Tuesday's price and volume action showed a possible run towards the recent highs we entered into a new LONG position.

By Wednesdays open we knew we were probably wrong on this trade but as always we stick to our trading plan and dont try to out guess the market.

Wednesdays gap down and lackluster price movement on low volume was quickly followed by increased volume and downward price movement as selling finally came into the sector Thursday and Friday.

Yes we were stopped out for a LOSS on this trade but it happens and will happen again.

Our SHORT positions more than made up for this one losing trade.

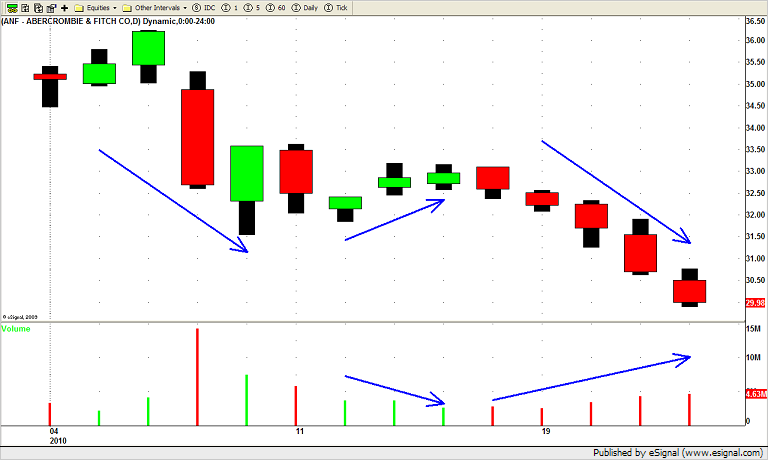
One, for example, that played out perfectly was our SHORT SWING TRADE in ANF.

ANF Short Swing Trade

ANF triggered a SHORT SWING TRADE for us last Friday (1/15/2010).

The sector (retail) has been weak and ANF was showing signs of obvious weakness as well.

Notice how ANF did not participate in the markets UP move on Tuesday as price "stalled" on lower volume.

Wednesday ANF quickly followed through by trading lower on increased volume and the rest of the week was more of the same.

At pivotal times in the market we frequently find ourselves having a few LONG positions (in stocks showing relative strength) and a few SHORT positions (in stocks showing relative weakness).

Once the market gives us a clear signal (like it did this week) we can take the appropriate action and get on the right side of the market.

Until next week…Good Trading to you!

© Swing Trading Boot Camp 2024