Archive for the ‘ETF Trading’ Category

Swing Trading Week in Review – October 1, 2010

Sunday, October 3rd, 2010

Swing Trading BLOG – Swing Trading BOOT CAMP

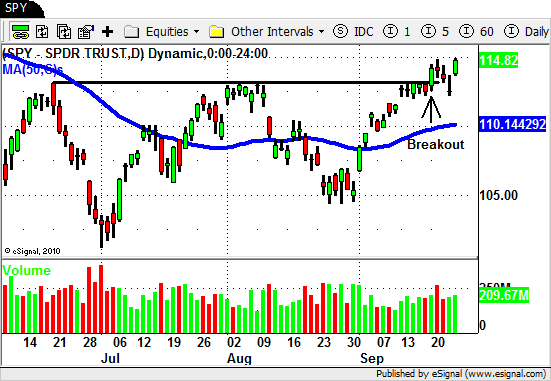
Well after the long awaited BREAKOUT we saw last week the market followed up with…a nice long week of NOTHING!

Coming into this week there was a lot of optimism based on the recent bullish action we have seen in the overall market.

Traders (including us) were expecting at least a little follow through this week but instead were met with yet another frustrating week of consolidating price action.
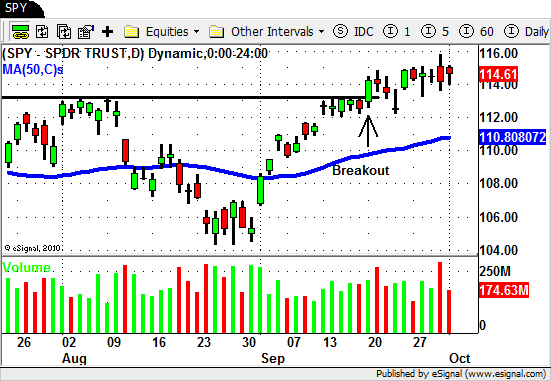
SPY

Most of the stocks and ETF's did the exact same thing as the overall market.

A few were up slightly as the week came to an end but nothing to write home about.

There were a few exceptions as we saw the Energy and Oil Services ETF's have nice continuation moves this week.

In last weeks BLOG post we showed you our entry into XLE and the pullback that followed.

This week XLE continued its UP move despite the "stall" in the overall market.
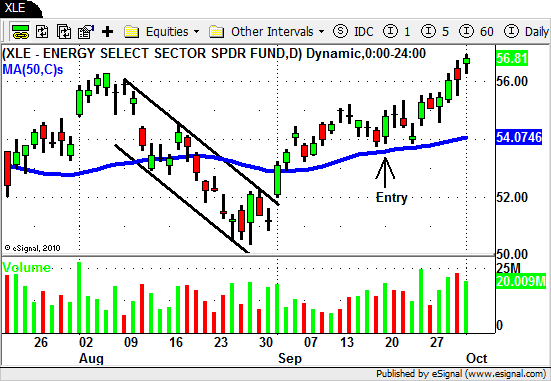
XLE

As you would expect the Oil Services ETF (OIH) had a strong week.

RIG and DO were two stocks in this sector the gave us LONG trade signals this week.
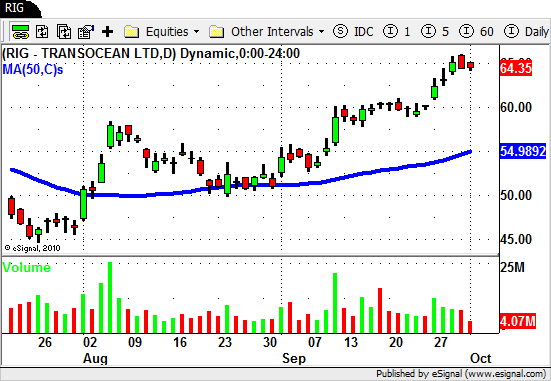
RIG

GOLD and the GOLD MINERS (GDX) came back to life this week as well and SILVER (SLV) is acting just as bullish.

With last weeks news in the AIRLINE sector we saw the Airline ETF (FAA) trade up to a NEW HIGH for the YEAR.

Technology, Retail, Real Estate, Financial and the Homebuilders all had a lackluster week.

One sector to watch moving forward is going to be Agriculture.

This week we saw big time selling come into some of the stocks in this recently strong sector.

MON, MOS, CF and ADM all sold off this week despite the market holding up above its BREAKOUT level.
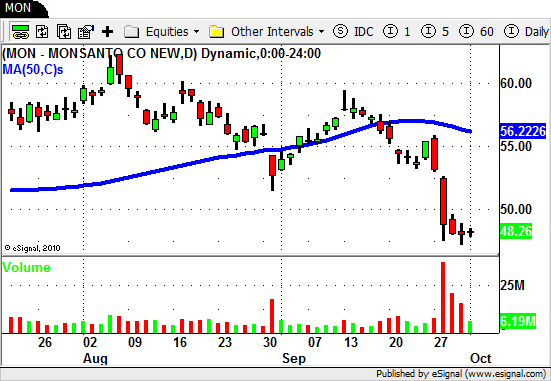
MON

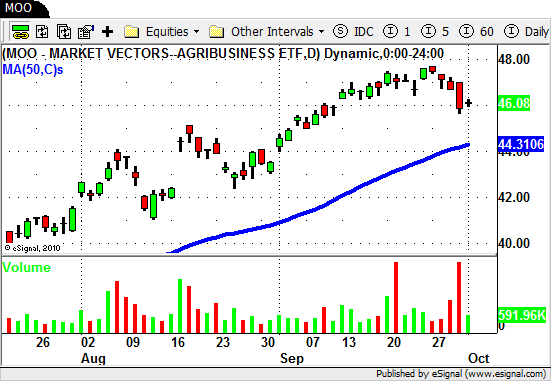
The Agriculture ETF's (DBA and MOO) have now put in their first significant pullback after last months nice run up.

This pullback may be a good time to look to buy some of the stronger names in this sector but the caution light is now flashing as we move forward.
MOO

This type of price and volume action is not yet a transition from a "bullish" to "bearish" bias for this sector but it is something to watch for in days/weeks to come.

The overall market is still very strong as almost every major sector ETF is trading above its 50 day SMA.

Last weeks "consolidation" is telling us that the buyers and sellers are playing a big game of tug-of-war at this level.

Obviously anything is possible next week.

A continuation move to the UP side wouldn't surprise us but neither would a retrace back near the 50 day SMA.

The key (as always) is to be prepared with a plan of action for either outcome.

What stocks and/or ETF's will you look to buy if the UP move continues?

What will you do if the market sells off on Monday indicating that the market is pulling back?

Will you SHORT anything or simply sit on the sidelines and wait?

You know what they say..."failing to plan is planning to fail".

Have your plan is place and execute when the time is right!

Until next week…Good Trading to YOU!

Swing Trading Week in Review – September 24, 2010

Sunday, September 26th, 2010

Swing Trading BLOG – Swing Trading BOOT CAMP

Well we FINALLY got the directional move in the market that everyone has been waiting waiting for.

The BREAKOUT we saw on Monday was quickly followed by a 3 day shallow pullback which had some traders thinking the market was up to it's same old tricks.

SPY

With the way some of the individual sector's were acting we were actually thinking the same thing.

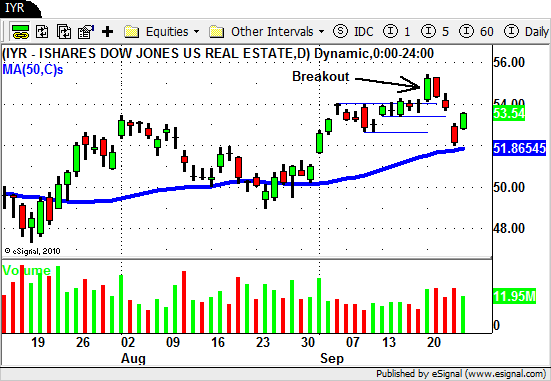
After holding up nicely for so long the Real Estate sector ETF (IYR) broke out with the overall market on Monday.

For the 3 days following the BREAKOUT sellers aggressively came in and drove this ETF well below the level of last week's consolidation.

Here is the chart…

IYR

You can see how this BREAKOUT failed and stopped us out (and a lot of other traders I would assume) as it retraces all the way back to it's 50 period SMA.

A swallow pullback in lines with the overall market was expected from such a strong ETF so this type of price action was not only frustrating but concerning as well.

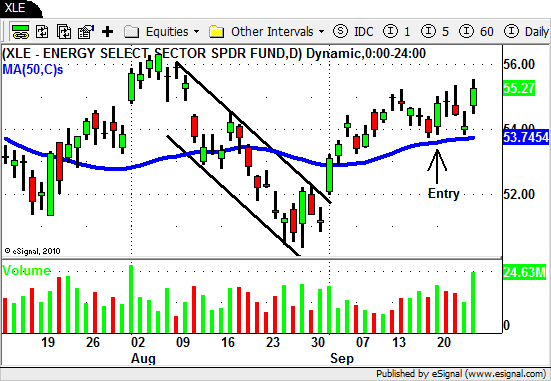
The Energy sector ETF (XLE) had similar price action after giving us a LONG signal on Monday.

XLE

The retrace that followed created an "equal bottom" and came very close to our initial STOP LOSS level.

Friday XLE continued it's move up as the overall market BROKE OUT again.

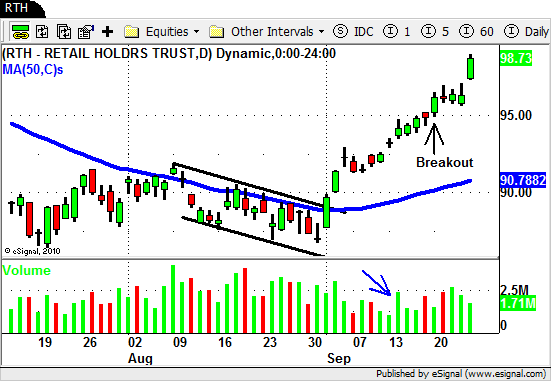
The Retail sector ETF (RTH) continues to be the rock star!

RTH

Even after being short term OVERBOUGHT we saw RTH break to the UPSIDE Monday.

RTH then created a nice swallow, almost sideways consolidation during the 3 days that the overall market pulled back.

Friday the strength in this sector continued as RTH gapped up and traded through the $94-$96 level we mentioned last week.

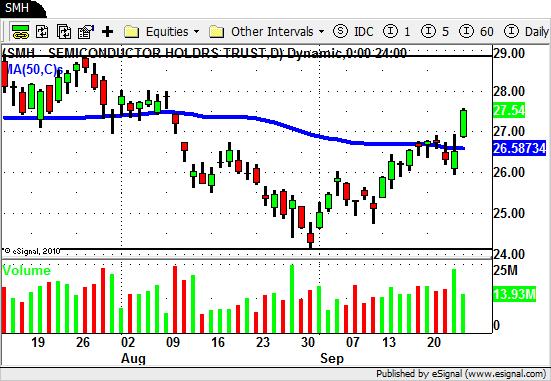
One sector in transition this week were the Semiconductor's.

SMH

The SMH has been a real laggard but this week we saw buyers step in a finally bring this ETF back above it's 50 day SMA.

Although CREE and SNDK did result in new SHORT trades for us early in the week overall this sector seems to have found some new strength.

KLAC and NVDA stand out so we will watch some of the other stocks in this sector as we move into trading next week.

Friday was one of those days that there were so many trades that were triggering that it was hard to keep up!

We saw a ton of stocks BREAKING OUT and some stocks that just continue to RIP to the upside without even taking a breather.

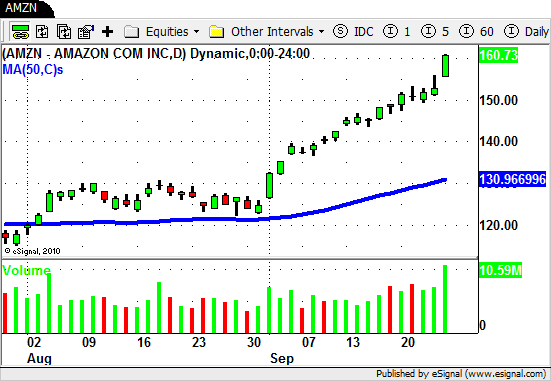
Amazon (AMZN) opened this month at $126 and has gone straight up since then!

No retrace, no pullback just a parabolic RIP up to (so far) $160!!!

AMZN

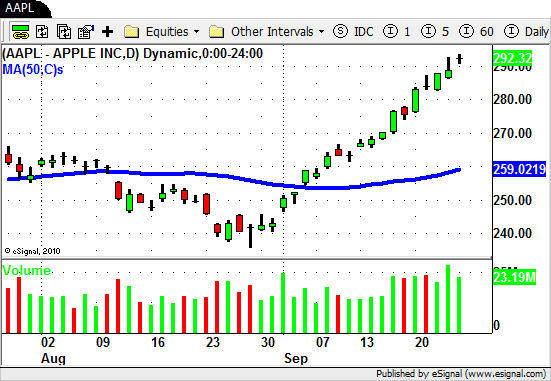
Apple (AAPL) has basically done the same thing by going from the $240's straight up to close above $292 on Friday!

AAPL

Some of the BREAKOUT stocks our list included AGU, MMR, CCJ, INFA, HAL, SMG, WYN, NTAP, QCOM, CMI, EQIX and our recent money machine SOHU.

Not our entire list but a good list of stocks to watch as we move forward the next few weeks.

There were also a TON (way too many to list here) of non-breakout LONG trade setups last week.

This is a good sign of overall strength in the market and much better than just one or two sectors leading the way.

All in all the market is looking stronger and stronger but as always FOLLOW THROUGH will be the key.

Although there are a few stocks on our list that look weak it is hard to make a case for getting SHORT in light of the recent strength the market has shown us.

That being said we will continue to do what we do each day and prepare accordingly for each and every outcome that the market can present us.

Doing so allows us to react accordingly (and hopefully profitably) when the market decides what to do next.

Until next week…Good Trading to YOU!

Swing Trading Week in Review – July 16, 2010

Saturday, July 17th, 2010

Another interesting week in the market!

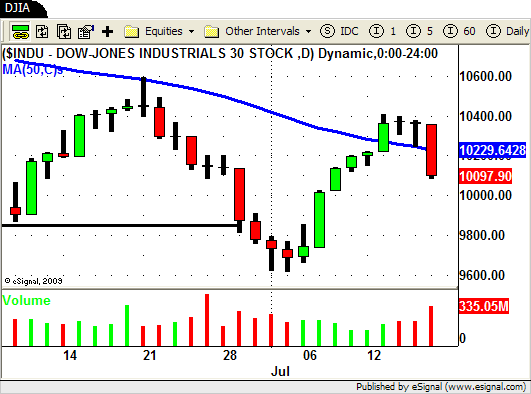
After pulling back off of the recent lows the market heads back down as sellers aggressively drove the market down on Friday.

DJIA - Swing Trading

Last week we saw the market pullback on LOW volume so going into this week we were looking for signs that this "retrace" was losing steam.

Monday and Tuesday's price and volume action let us know that the overall market had NOT yet ended its retrace BUT some of the individual stocks and ETF's that were on our watch list told a different story.

Since we have recently taken out the February lows in the market and we are still trading under the 50 day SMA our bias remains to the SHORT side for our "bread and butter" strategy.

In a perfect world we would be able to time our trades to match when the overall market makes its move but usually that is not the case.

Often times individual stocks (or specific sector ETF's) will lead the market by moving prior to the overall market.

In a down trending environment we often see the "weakest" stocks start to move lower even as the market is moving slightly higher.

The opposite is true for a up trending market.

"Strong" stocks will often breakout well before the overall market gives you confirmation that it is going higher.

We saw this happen at the beginning of the week as several of the stocks on our watch list triggered a SHORT entry signal.

Monday the market started to head lower but ended up closing near its high albeit on lower volume.

When the market gapped up on Tuesday some of our SHORT positions moved UP with right along with it.

The gap up in these stocks was of some concern but most stayed well below our initial STOP LOSS levels so we simply held  our positions.

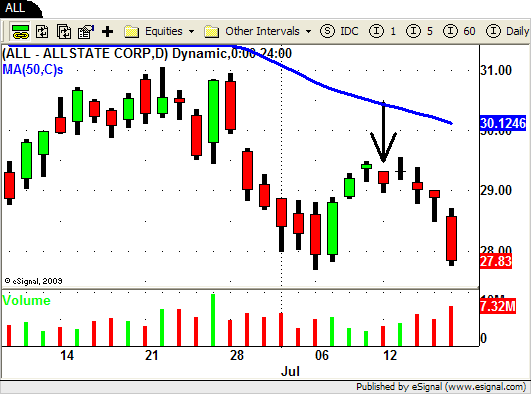
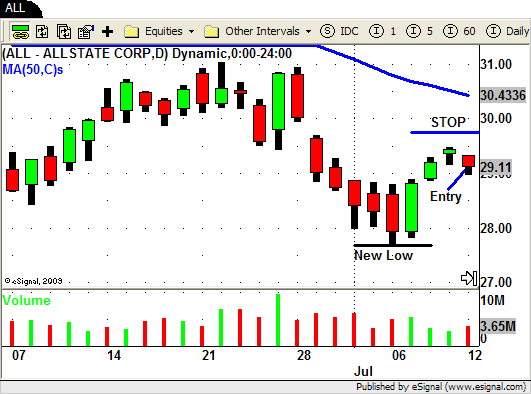
Allstate (ALL) is one our trades that triggered on Monday.

ALL - Short Swing Trade

After hitting new yearly lows last week ALL put in a nice LOW volume 3 day retrace at the end of last week.

Monday you can see how ALL traded through Friday's low on increasing volume.

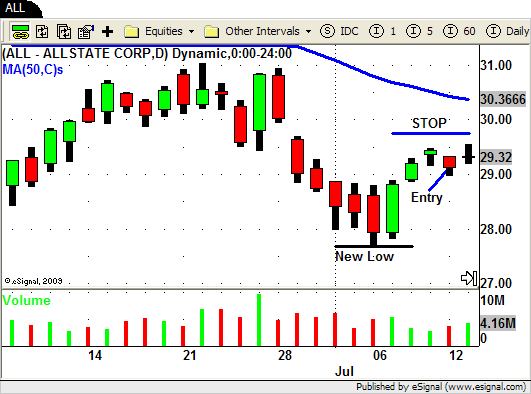
Our SHORT entry was triggered and we set our initial STOP LOSS level at $29.87 which is 1 ATR ( .77) away from our entry ($29.10).

ALL - Short Swing Trade

It is important to note here that by using the Average True Range (ATR) of the stock we were able to position our stop above an area where a chart pattern based stop would have been placed.

Using our Average True Range (ATR) again we would use a multiple of 2 (2 x .77= $1.54) to set our profit target at $27.57 ($29.20 – $1.54= $27.56).

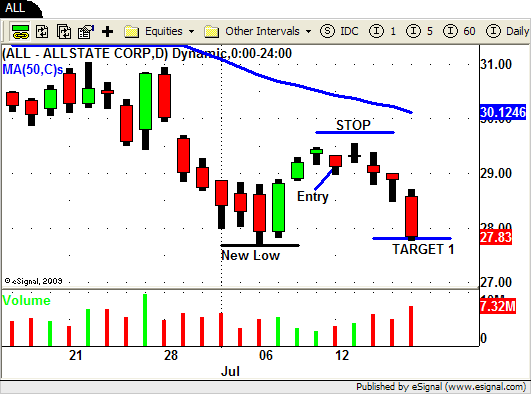
However based on the chart we set our initial PROFIT TARGET at $27.78 which is just above the previous Swing Low at $26.68.

This is not quite a 2:1 risk/reward  but we put our target just above the possible support level and would cover a portion of our position at this level and let the remaining shares run.

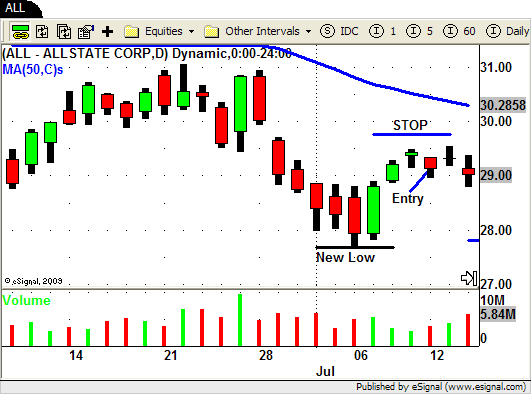
Tuesday you can see how ALL gapped up a bit with the overall market but stays well below our ATR based stop.

ALL - Short Swing Trade

Wednesday ALL finally follows through to the down side and volume increases even as the overall market holds up.

ALL - Swing Trading

The end of the week brings more more of the same and near the close on Friday ALL hits profit target #1 as the market sells off.

ALL - Short Swing Trade

Some of the other stocks on our list that turned out to be good SHORT trades were APC, ZION, CLF, and SLX.

There were a lot of trades this week and its hard to go over them all in this BLOG.

At our "Indicators and Oscillators" webinar last night we went through each and every one of our trades.

We analyzed trades in MOS, AKAM, ALTR, XLNX, and ETF's like DXD, SRS and SKF.

We discussed how we use our indicators in conjunction with price action, volume and trend lines to make our trading decisions.

Based on the feedback we received it was a very insightful webinar for you short term traders!

Our next webinar is our popular "Swing Trading Weekly Wrap Up" where we do more of the same.

We analyze the market and sector ETF's and go over our trades in detail.

Please bring your questions and the symbols of the stocks or ETF's you want to discuss.

We look forward to seeing you there!

Until next week…Good Trading to YOU!
Swing Trading Week in Review – July 9, 2010

Sunday, July 11th, 2010

Swing Trading Blog Post –

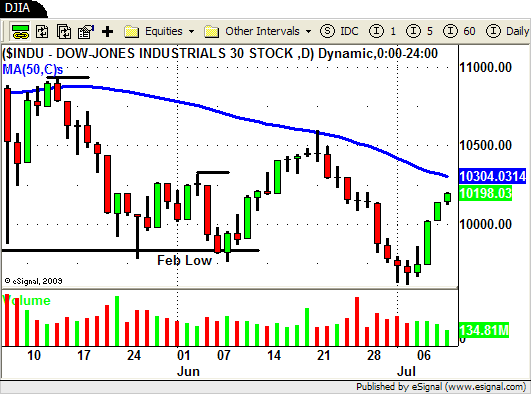
This week the markets put in a pretty decent "pullback" off of the recent lows.

After such an extended and fast down move during the last 2 weeks this type of trading action should have been no surprise.

Here is how the chart of the DJIA looks after Friday's close.

DJIA

Taking everything into account this week was NOT the week to ENTER into any NEW short positions.

As a matter of fact if you swing trade using price action and volume then the charts were telling you this.

After 2 weeks of basically straight down trading we were looking for signs that the market was losing steam.

After being closed on Monday the markets gapped up Tuesday morning.

This was the first sign for us that the market MAY be starting to retrace off of its recent low.

The market did close "weak" on Tuesday BUT price held above the low of Friday AND the volume was light.

This was a good sign to us that the short term sentiment could be changing.

By seeing this type of price and volume action on the chart you had a few options depending on your trading style.

If you only trade one side of the market and you were already SHORT then you could have tightened up your trailing stops.

If you are a bit more advanced then you could use a "STOP and REVERSE" type trading strategy by getting out of your SHORT positions and entered into LONG positions (in the same stocks or ETF's) to trade the "bounce" or "pullback".

Although trading both sides of the market can be very profitable it does take a complete understanding of how price and volume work together in the context of trends.

You also should understand that by trading both sides of the market that often times you are taking trades against the main trend.

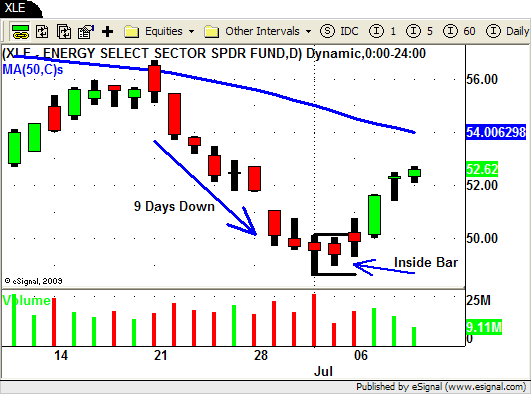
Lets take a look at the chart of the Energy Sector ETF (XLE) to show you what I mean…

XLE Swing Trading ETF

After trading down for 9 days straight we are looking for signs that the current down move may be coming to an end.

Last Friday you can see how XLE creates an "inside bar" on low volume.

This type of "stalling" price action can often times be the first clue in identifying sentiment changes.

As the market gapped up on Tuesday XLE gapped up above the high of both Thursday and Friday.

After such an extended move down (9 days) this type of chart pattern is something you would expect to see at the start of a retrace.

We need to understand though that this retrace is in a currently DOWN TRENDING market.

If you enter into a LONG position here you will be doing so AGAINST THE MAIN TREND.

Knowing that you will be be trading against the trend we strongly recommend that you make sure that you use a tight stop and a smaller profit target.

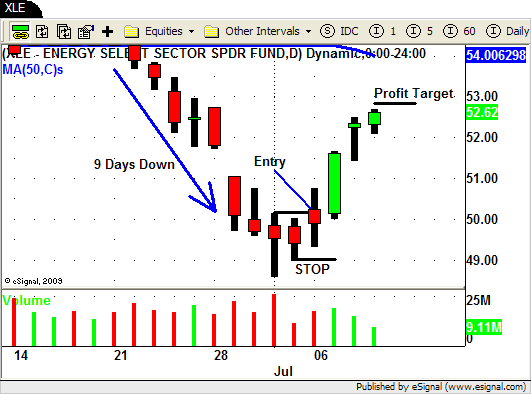
We use a 2:1 profit target for most of our SST (Short Term Swing Trades) including this one.

That being said our entry signal was on the open on Tuesday at $50.24.

XLE Swing Trade

Our initial STOP was placed just below the low of the "inside bar" at $48.94.

That gives use a risk of $1.30/share (50.24 – 48.94 = 1.30).

We then set our PROFIT TARGET $2.60 ($1.30 x 2 = $2.60) above our entry price at $52.84.

With our initial STOP and PROFIT TARGET in place we now move into managing our trade by watching price and volume.

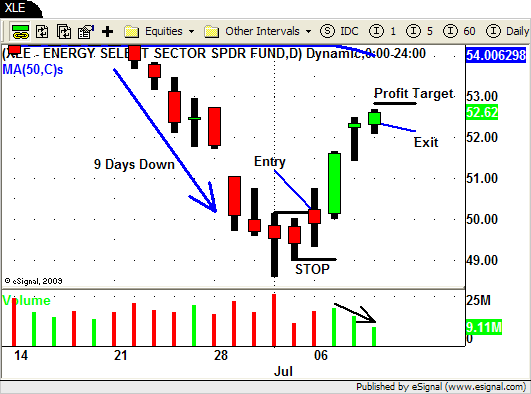
Wednesday price moves HIGHER on INCREASED VOLUME…so far so good!

Thursday price moves higher yet again BUT volume decreases as does the intraday range.

We hold since price moves higher but the CAUTION light is flashing.

Friday price moves higher again BUT volume drops again and so does the range.

XLE trades as high as $52.70 (.14 from out PROFIT TARGET) and we end up exiting our position near the close at $52.64.

XLE Swing Trade

As of the close on Friday XLE looks to be putting in a classic retrace from its recent low.

Price is moving higher as volume and range is decreasing.

No one knows what Monday's market will do and XLE could continue to move higher.

By trading just .14 away from our profit target this was "good enough" for us and we will take our profits and run.

Take a look some of the stocks and ETF's on your list and see if you can spot how price and volume gave you a heads to the short term sentiment change we saw last week.

And as always if you have any question please feel free to post them below.

Until next week…Good Trading To YOU!


© Swing Trading Boot Camp 2025