Archive for the ‘ETF Swing Trading’ Category

Swing Trading Week in Review – August 31, 2012

Monday, September 3rd, 2012

Swing Trading BLOG – Swing Trading Boot Camp
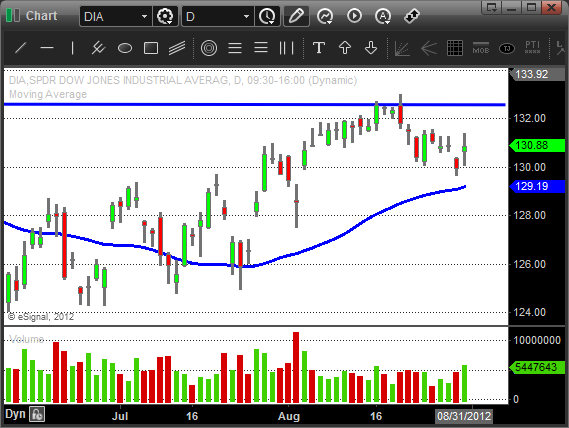
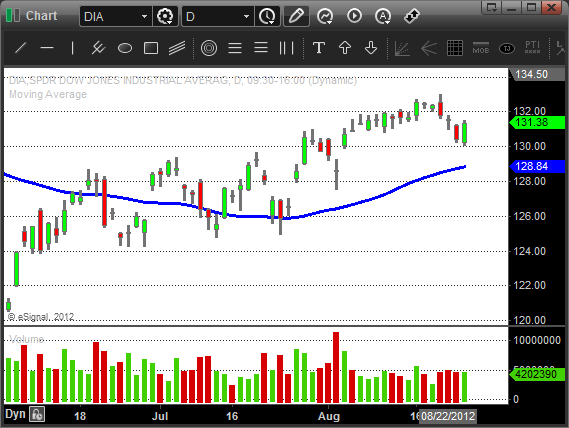
$DIA - Swing Trading ETF

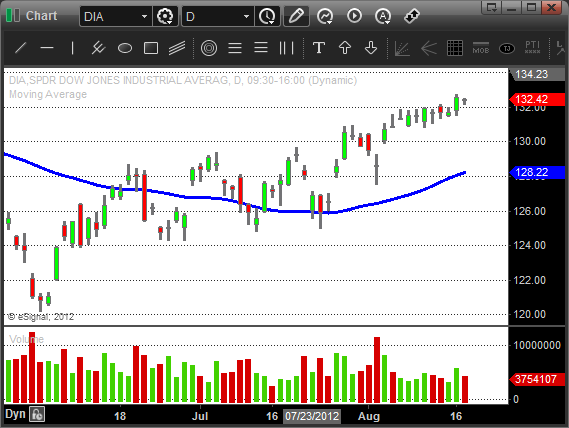
The market move lower the first four days of trading this week.

The pullback comes after bumping into some overhead resistance at the yearly highs that were put in a few months back.

Fridays price action and volume confirmed that all three indices have ended this recent retrace and are once again attempting to head higher.

Individual stocks were mixed but there were a few stand out sectors for both day and swing traders.

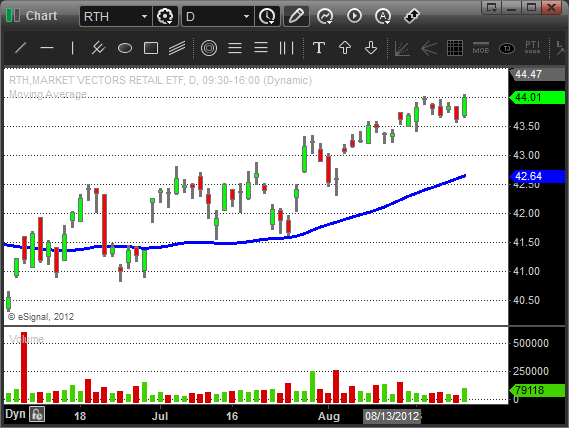
The Retail sector ETF ($RTH) bucked the trend and continued to move higher all week…
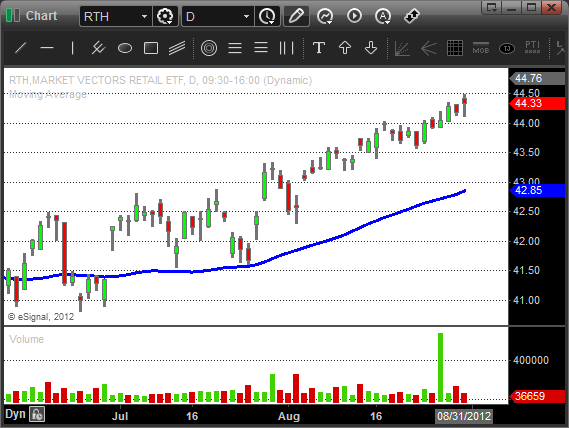
$RTH - Swing Trading ETF's

The Hombuilders ($XHB) traded sideways as the market pulled back this week.

The breakout on Friday is one to watch..
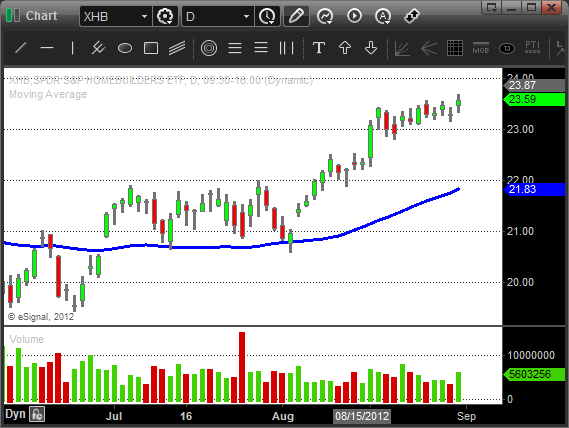
$XHB - Swing Trading ETF's

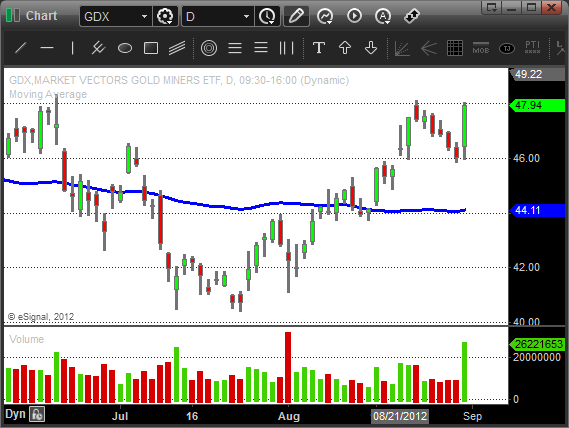
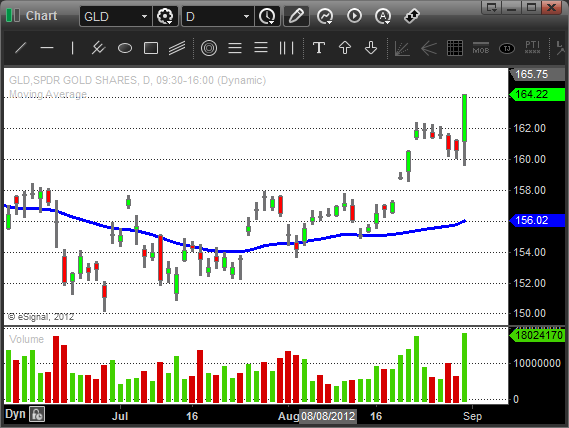
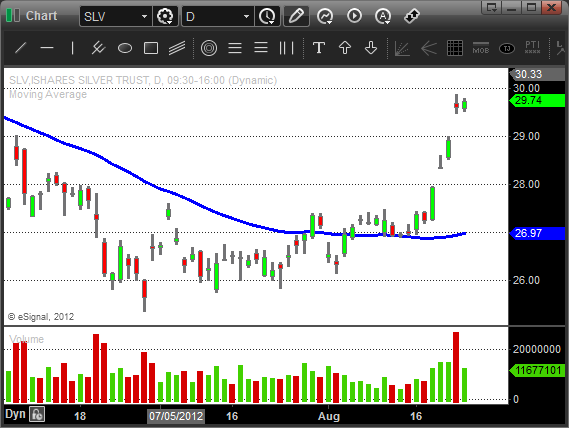
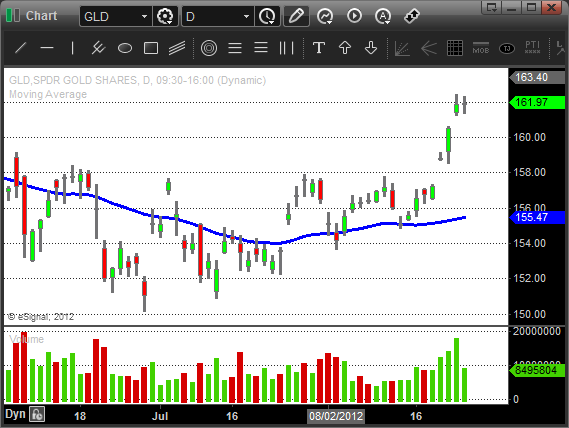
Last week we also mentioned that the Silver and Gold ETF"s ($SLV $GDX $GLD) were making some nice moves to the UPSIDE.

After pulling back to start the week both sectors exploded higher on Friday…
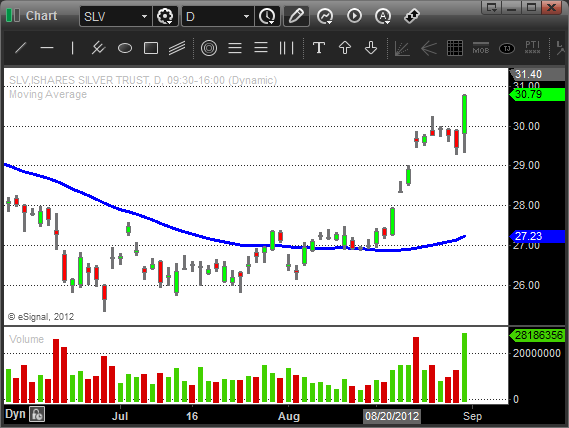
$SLV - Silver ETF's $GDX - Gold Miners ETF $GLD - Gold ETF

One sector that took a big hit this week was the Steel sector ($SLX)….
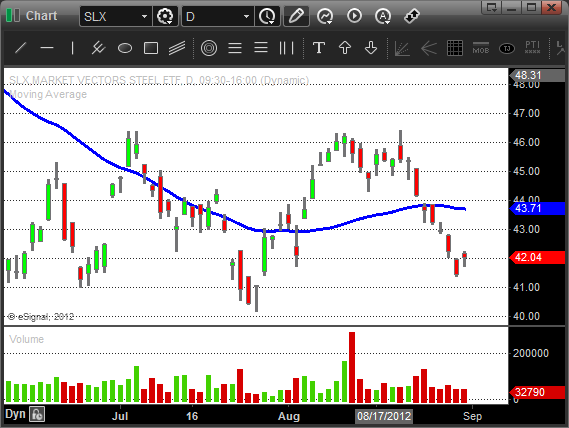
$SLX - Steel ETF

The price action here indicates that the sellers are here in a big way even though the overall market is holding up.

This is a good example of relative weakness and something to watch especially if the market transitions from bull to bear in the near future.

Keep your eyes peeled as we open for trading on Tuesday (due to the holiday on Monday) and looks for signs on continuation of Fridays move.

Get your Watch List ready and as always be prepared for whatever the market throws at you next week.

Until then…Good Trading to YOU!

Swing Trading Week In Review – August 24, 2012

Sunday, August 26th, 2012

Swing Trading Blog – Swing Trading Boot Camp

$DIA - Swing Trading Blog

Traders got the much anticipated pullback that they have been waiting for this week.

The week started off the a lackluster Monday but Tuesday traders flipped to the SELL SIDE after pushing the market up in early morning trading.

After two more days of selling pressure the market finished the week with a nice up day on Friday.

The type of price action we saw in the market this week came as no surprise since we were trading back up in the area of the yearly highs we reached  earlier this year.

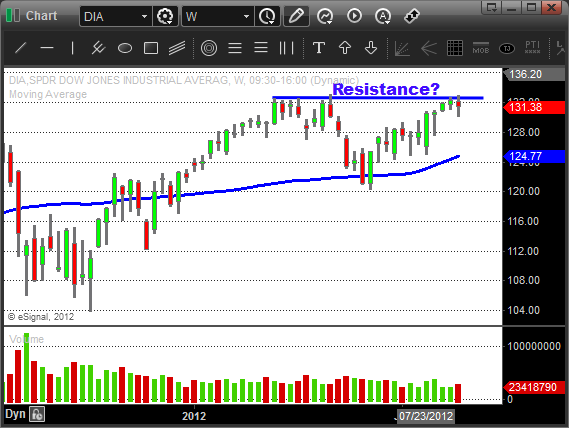
Here is the weekly chart of the $DIA that we have posted for the past few weeks on our blog…

$DIA - Weekly Swing Trading Chart

You can see from the chart above that the market has some significant potential resistance in this area.

This creates a bit of an issue for some traders.

Do you get or stay LONG knowing that resistance level is directly ahead? Or do you wait to see how the market reacts to this area and possibly miss the breakout?

Well if you follow us on our blog or newsletters you will know how we do it.

We simply trade our plan and never try to outguess the market.

We have learned after years of trading that the market is always right.

As cliche as that sounds… it's true!

We trade our setups as they happen and never don't take trades based on what we think MAY happen.

Could we look back after the fact and wish we had done differently? Of course but as they say hindsight in always 20/20.

We have stops in place and a sound money management strategy so we let the do there thing.

If we are wrong we simply take our loss and move on and reevaluate.

If we are it is a very similar almost robotic process.

We exit at our profit target and move on and contemplate our next move.

Simply put we have a plan and we stick to it no matter what.

That being said as we look through the charts for this week we see lots of trades to the LONG side.

Most sectors are still strong with Retail ($RTH) breaking out again on Friday.

$RTH - Swing Trading ETF's

Technology and Oil and Energy remain strong while the Homebuilders and Financials are on the move again.

The Silver and Gold sectors RIPPED to the UP side this week so keep an eye on these ETF's and stocks in this sector…

$SLV - Silver Swing Trading ETF $GLD - Gold Swing Trading ETF

The market is likely to come out swinging Monday morning so be ready and have your plan in place.

Watch price action and volume for clues to where the market is headed next.

Until next week…Good Trading to YOU!

Swing Trading Week in Review – August 17, 2012

Sunday, August 19th, 2012

Swing Trading BLOG – Swing Trading BOOT CAMP

$DIA - Swing Trading BLOG

The sloooooow grind continues…

Swing Traders faced more of the same this week as the market is slowly making it's way higher.

For the last 2 weeks the move has been more of a crawl than a true breakout.

The DJIA as been a "turtle" but the technology focused NASDAQ has been moving up nicely.

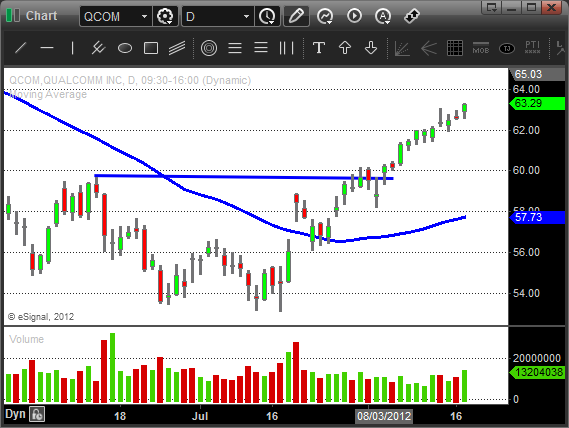
When we look deeper into the tech sector we can see names like $AAPL and $QCOM making some nice moves while the tech/retail stocks like $AMZN also followed suite.

$QCOM - Swing Trading Chart Patterns

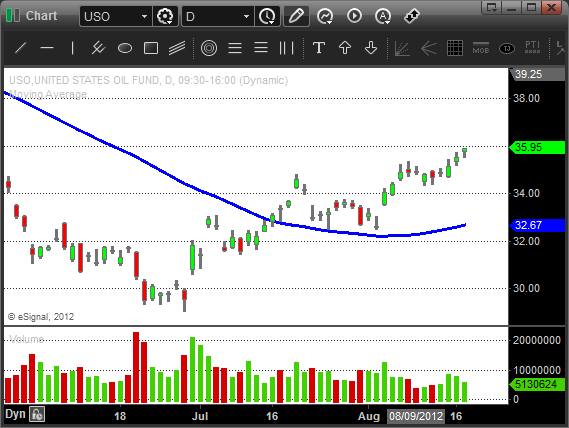
The recently strong Energy and Oil sectors showed signs of life again on Thursday.

$XLE, $USO, and $OIH all moved to multi month highs to end the week.

$USO - Swing Trading ETF

The Retail sector ($RTH) also broke to new highs this week.

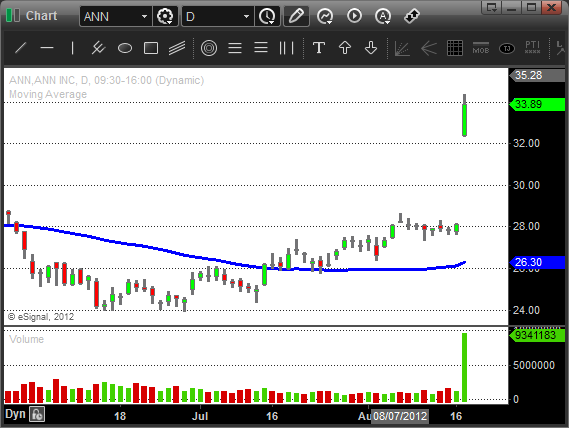
$TGT, $WMT, $RL and $M all had nice moves and if you were lucky enough to be LONG $ANN the GAP UP was a nice surprise!

$ANN - Swing Trading Chart Patterns

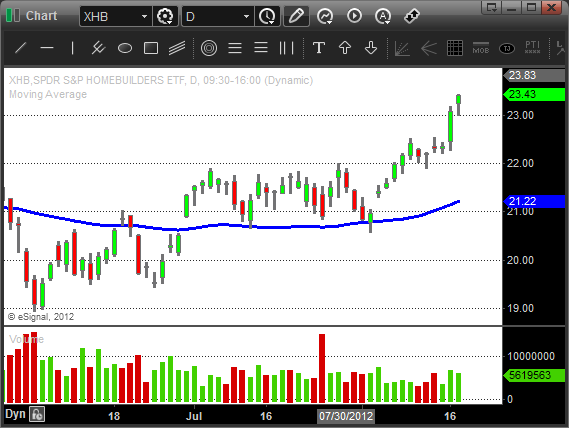
The Financials and Homebuilding sectors are playing along as well.

$XHB - Swing Trading ETF

Plenty of choices to make on the LONG side no matter what your trading strategy is.

All in all this has been a great move up in the market since we bottomed out in early June.

Once we cleared the sideways trading early this month the wind has been at our back.

With that being said both the S&P and NASDAQ remain in extremely short term overbought territory.

Be cautious as we move into next week and don't chase trades…let them come to you.

Until next week…Good Trading to YOU!

Swing Trading Week in Review – August 3, 2012

Sunday, August 5th, 2012

Swing Trading Blog – Swing Trading Boot Camp

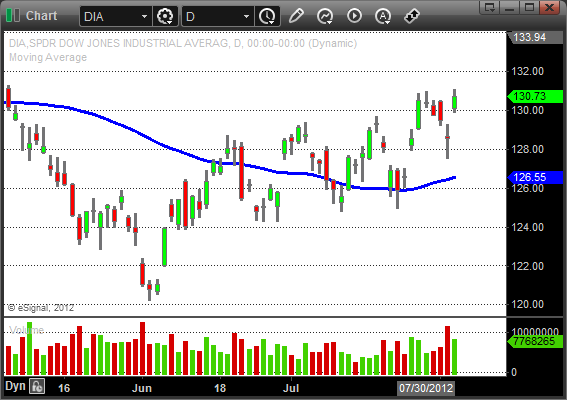
DIA - Swing Trading Strategies

After a strong up move last week swing traders watched as the market pulled back for four consecutive days to start this week.

Fridays price action however confirms that we are still in a bullish trend.

The big GAP UP had traders scrambling to get LONG again and might have caught a few traders short.

The most recent move is technically another higher high in all three major indices.

The volume patterns indicated some heavy selling last week so lets see if the buying volume confirms this move to new highs.

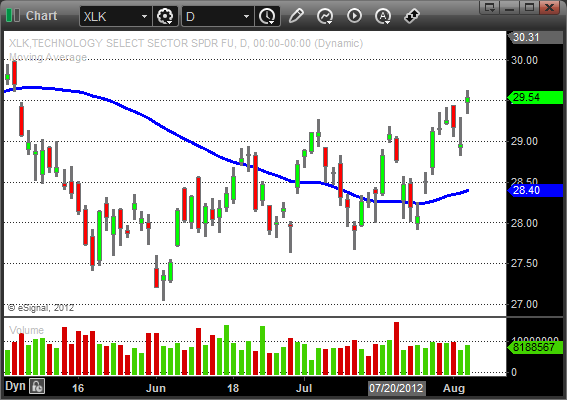
The sector action remains consistent with the strong sectors getting stronger and showing signs of moving higher.

Retail, Technology, Financials,  and the Energy and Oil sector ETF's had some good chart patterns to trade.

$XLK - Swing Trading ETF's

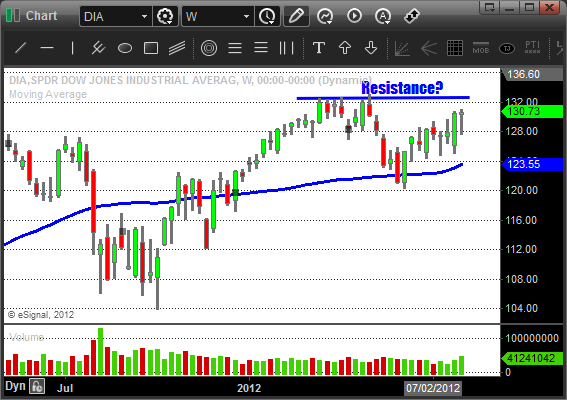
As we move into next week just be aware that we still have some substantial overhead resistance to contend with.

All three major indices put in the yearly highs in early April and then failed to move higher after that.

Here is a look at the weekly chart of the $DIA…

$DIA - Weekly Swing Trading Chart

Look for the strongest stocks with the best chart patterns to trade.

Pay attention to price action and volume if we make a run to the April highs.

Have a plan for whatever the market decides to do from here.

Until next week…Good Trading to YOU!

© Swing Trading Boot Camp 2024