Archive for the ‘Day Trading’ Category

Intraday Swing Trading Strategies – The “3Down” Chart Pattern

Thursday, December 13th, 2012

Intraday Swing Trading Strategies – The "3Down" Chart Pattern

This morning we were on the watch (as always) for one of our favorite chart patterns…the "3Down".

We had a few stocks on our list this morning but one stock that stood out like a sore thumb was $MON.

$MON was showing unusual relative strength this morning as the overall market tried to find its way.

Both the DJIA and S&P both sold off early and hit NEW LOWS on the third 5 minute bar of trading today.

Here is the chart of $DIA…
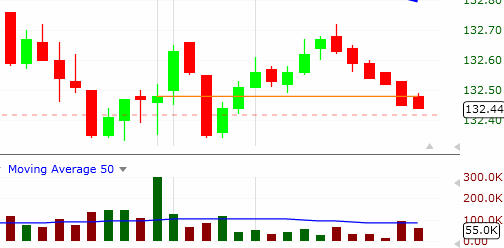
$DIA - Intraday Swing Trading Strategies

And now take a look at $MON for comparison…
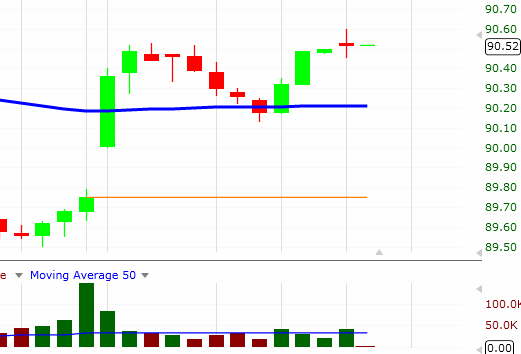
$MON - Intraday Swing Trading

The strength is obvious.

So now that we know we have a strong stock in a relatively weak market what do we do?

We watch and wait.

As the $DIA finds a bottom and start to retrace $MON starts to pullback.

We know at this point that the chances are high that the strength in $MON will not continue if the market starts to push lower again.

If however the overall market transitions from weak to strong then $MON could make its next move higher.

The 10:15am bar is where all the action took place for this trade.

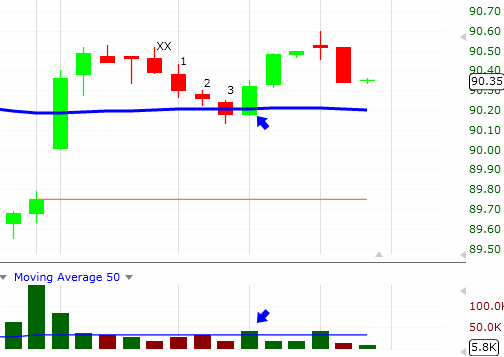
Here is the setup and the countdown chart for the "3Down"…
$MON - Intraday Swing Trading

Notice the first attempt to begin our countdown on the chart above.

The bar before the "XX" on the chart is the first "1" bar.

The next bars high is higher than the previous bar so we start over.

The bar after the "XX" starts our new count over at "1" since its higher is lower and its low is also lower than the previous bar.

The next 2 bars do exactly the same thing giving us our "3Down" setup!

Notice also how bar "3" has lower volume than bar "2". This means the selling is drying up.

Now that we have a valid "setup" we wait to see if we get an entry signal.

The 10:15am bar (marked with the BLUE arrow) provides us with a text book entry.

The volume starts pouring into this bar early so we can figure the price action will move one way or the other.

This bars low never trades below the low of the previous bar…bullish!

This bar trades above the high of the previous bar…bullish!

As the bar develops BUYING volume increases…bullish!

We are in the trade at $90.27 (.02 above the previous bars high) and we set our stop at $90.12 (.01 below the previous bars low) for an initial risk of .15/share.

Our STS profit target is at 2x the initial risk (2 x .15 = .30) so we set it at $90.57 ( $90.27 + .30 = $90.57).

Three bars after our entry $MON hits $90.57 (trades up to $90.61) and hits our target before beginning another pullback.

Day Trading Strategies – Intraday Swing Trading Strategy

Thursday, June 14th, 2012

Swing Trading Boot Camp – Day Trading the Intraday Swing Trading Strategy

We thought we would take this opportunity to walk you through one of our day trades from this morning.

Our Intraday Swing Trading Strategy is very similar to our overnight swing trading method.

We use relative strength to locate and trade strong stocks (or ETF's) when the overall market is strong.

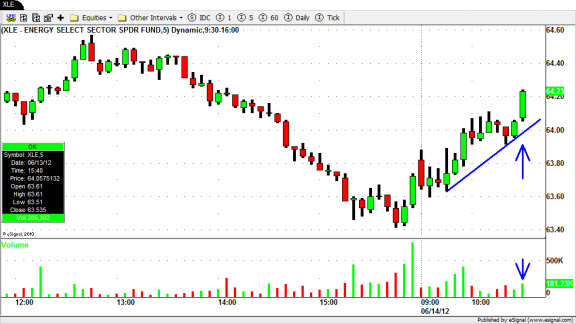
This morning was a good example of locating a sector ETF ($XLE) that was showing signs of relative strength AND also had a great chart pattern to trade.

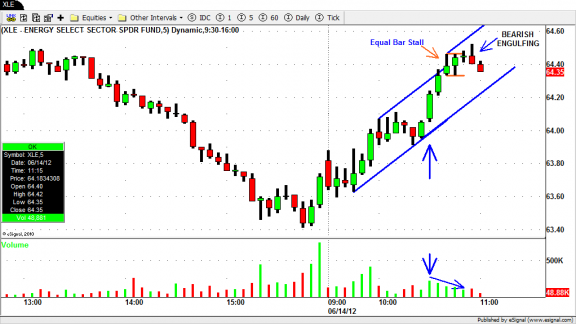
Here is the first chart for $XLE

XLE - Day Trading Strategies - Intraday Swing Trading

Notice how on the chart above $XLE broke out to new highs in the early morning and rallied up until a little after 10am.

After a brief pullback $XLE was setting up again for a nice LONG trade. A move to the upside on increased volume was the confirmation we needed (BLUE ARROWS).

Our trend line was drawn in and we let the trade progress.

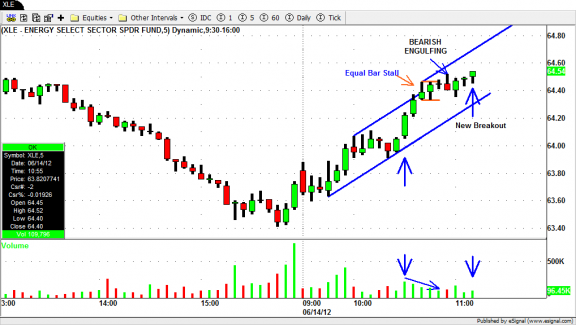
XLE - Day Trading Strategies - Intraday Swing Trading

On the chart above you can see how $XLE rallied to new highs again putting in 2 channel expansions before the "stall" (equal bar high) marked in orange.

This entire move happened on decreasing volume so we were on high alert looking for the signs of this move reaching its potential.

The"stall" was followed 2 bars later by a new high but this bar quickly reversed course and put in a bullish engulfing candlestick.

This bar combined with the failure to reach the top of the channel is a good sign that the move has come to an end and a good time for us to exit our trade.

The next bar followed through to the downside but we noticed that volume was drying up.

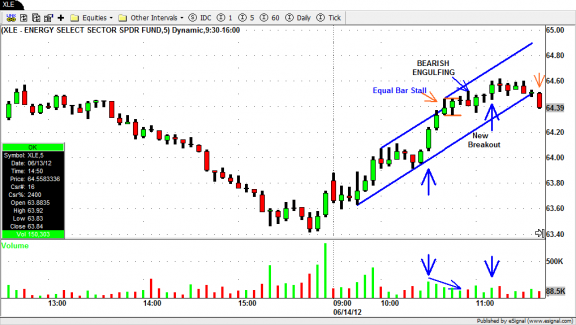
XLE - Day Trading Strategies - Intraday Swing Trading

The bar after the bearish engulfing bar reversed and closed near its high. Two bars later a new breakout was underway.

We didn't want to enter into a new LONG trade at this point since the move in $XLE was already extended a bit.

Below you can see how the new breakout stalled and basically traded sideways for the next 6 bars before finally breaking down and out of the upward trending channel.

XLE - Day Trading Strategies - Intraday Swing Trading

Even if the new breakout would have continued we aren't really concerned about it.

We are NOT trying to catch  every single bit of every move.

For our STS trades we typically set our target at a 2:1 risk/reward ratio and are very happy taking our profits at this level just as we did here.

As day traders our intraday swing trading strategy helps us locate (and hopefully profit from) price "swings" in the market just like you see here.

We hope this sheds some light on the strategies and tactics we use to trade the market day in and day out.

Until next time…Good Trading to YOU!

Intraday Swing Trading Stocks and ETF’s

Tuesday, February 14th, 2012

Swing Trading BLOG – Swing Trading Boot Camp

Today I thought I would take some time to show you some examples of our Intraday Swing Trading strategies.

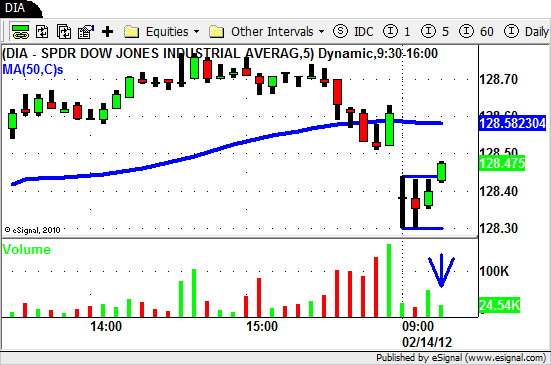
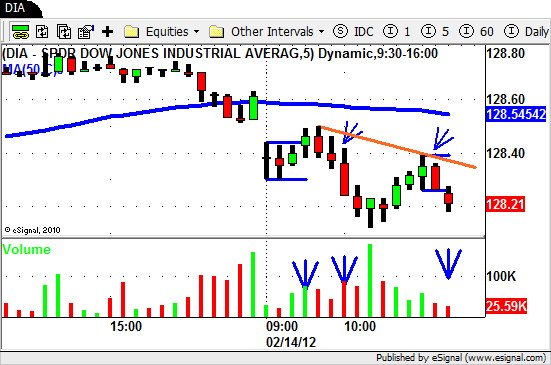
Lets first take a look at the Diamonds ($DIA) to see how the market started out this morning.

DIA - Intraday Swing Trading

In the chart above you can see how the market GAPPED DOWN opening well below yesterdays close.

You can then see the two bars after the open are "inside bars" and this gives us a nice pattern to trade once we get a breakout.

We always wait 15 minutes (3 bars) to allow the market to establish itself before we look to enter into a trade so this was a good setup for us.

As volume starts to pick up Bar #4 creates a BREAKOUT to NEW HIGHS.

Both price action (3 bar break) and increasing volume are exactly what we need.

We looked around and there were plenty of stocks with a similar pattern to trade.

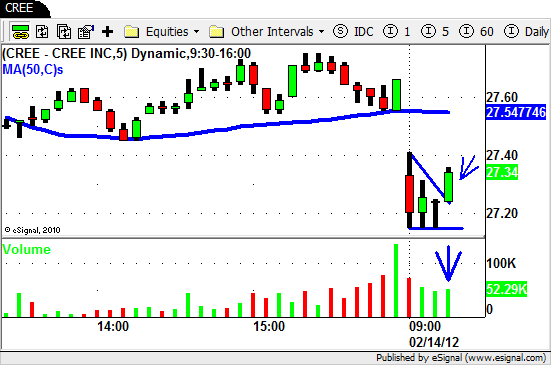
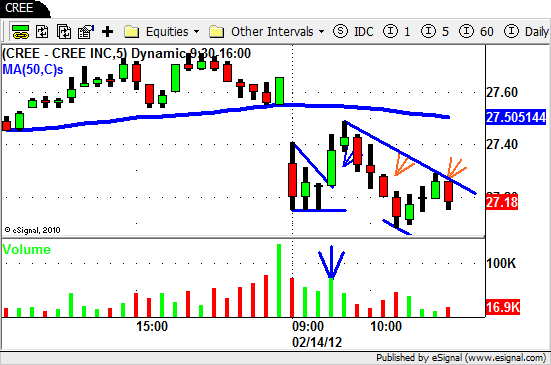
Along with $DIA $CREE stood out as a LONG trade to us with a nice pattern and defined risk.

$CREE - Intraday Swing Trading

Again the price action was good and volume was increasing.

The overall market (and $CREE) continued higher but then stalled out bit.

As an Intraday Swing Trader you have to nimble and and react quickly when the market shows signs of changing gears.

This type stalling action we see after a GAP DOWN is a flashing caution sign for us.

At this pivotal point of change you also need to scan the market to locate potential trading opportunities.

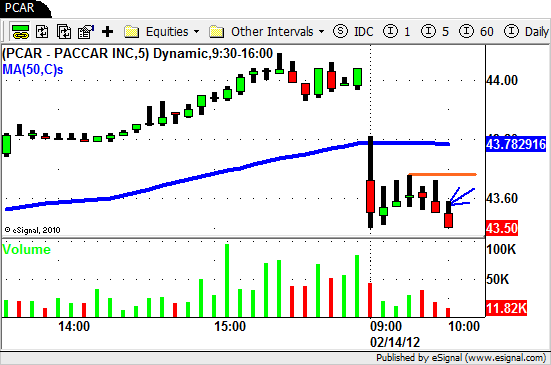
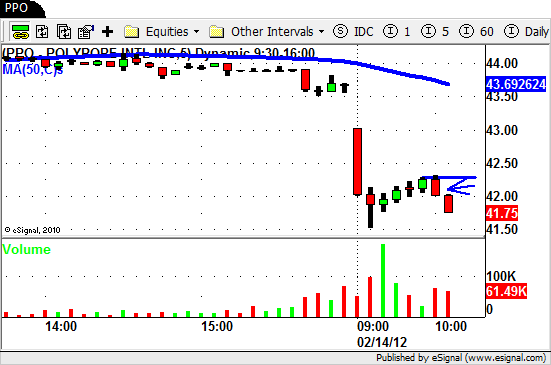
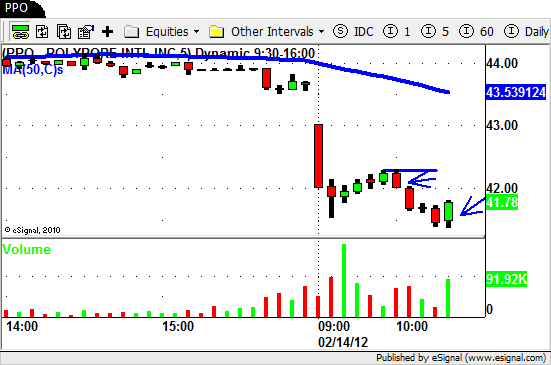
When the market "stalled" we began looking for stocks that were weaker than the overall market (relative weakness) and found $PCAR and $PPO.

$PCAR - Intraday Swing Trading $PPO - Intraday Swing Trading

Both stocks GAPPED DOWN with the overall market but never rallied to new highs when the market did.

Both stocks also created a very nice "lower higher" setups after an orderly retrace from their initial low of the day.

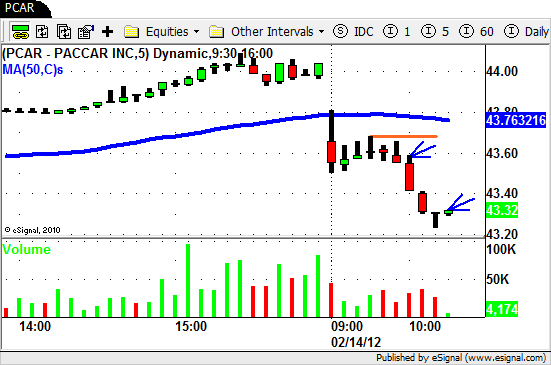
As the market begin to fall apart the selling volume started to accelerate in $PPO and $PCAR triggering trades in both stocks.

Our LONG trades were not looking good but we actually got out of $CREE with a profit.

Once the market broke to down to NEW LOWS we were now in SHORT mode.

Both $PPO and $PCAR pushed lower as well before showing signs of a retrace.

$PCAR $PPO

A few bars later and after a retrace off of the lows the $DIA was setting up for a move lower.

$DIA

$CREE eventually sold off with the market pushing down to a new low for the day.

$CREE was also now setting up nicely for a good SHORT trade.

The "lower high" was established and we were now able to draw our DOWN TREND lines to create a nice channel for context.

This is classic PVT trading!

$CREE - Intraday Swing Trading

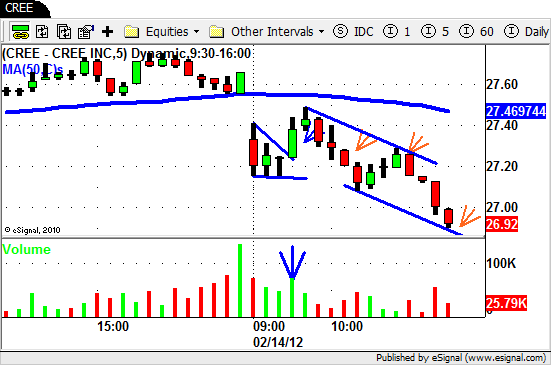
$CREE followed through nicely to the down side and created a "lower low" as the sellers stepped in.

$CREE - Intraday Swing Trading

$CREE pushed through the bottom of the channel expanding it a bit before showing signs of a retrace.

The price and volume action on the last bar in the chart below shows tell tale signs of the move coming to an end.

$CREE - Intraday Swing Trading

Since we only trade the first two and last tow hours of the day we were now "flat" as the market began to retrace just after 11am.

Here is a summary for our morning.

We went from LONG to SHORT in a few stocks and identified stocks that were weaker than the market.

Once the market "stalled" and began showing signs of breaking down we took trades in these "weaker" stocks.

The market followed through to the down side and these weak stocks sold off nicely.

After making new lows the market setup for another move lower which allowed us to enter into several new trades that worked out as well.

Hopefully this walk through gives you some insight into how we swing trade intraday.

© Swing Trading Boot Camp 2024