Does it take bad news about Goldman Sachs to cool the market off?
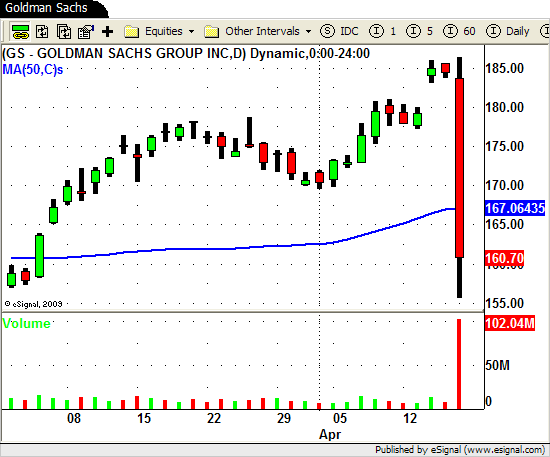
After four more days of the continuation rally the market finally ran into a speed bump on Friday.
News came out mid morning that the SEC sued Goldman Sachs in U.S. District Court in Manhattan, claiming the investment bank "committed fraud by misstating or omitting key facts about a synthetic collateralized debt obligation tied to subprime mortgages."
The news sent the market sharply lower, selling off over 150 points intraday, as sellers came out in droves after the news hit the wire.
After such a spectacular rally over the last 2 months this may be the catalyst to finally bring this market back to reality.
Time and time again we advise our students to "be prepared for ANYTHING" as this is a great case in point.
But before we go any further lets take a look at what the market did for the first four days of the week.
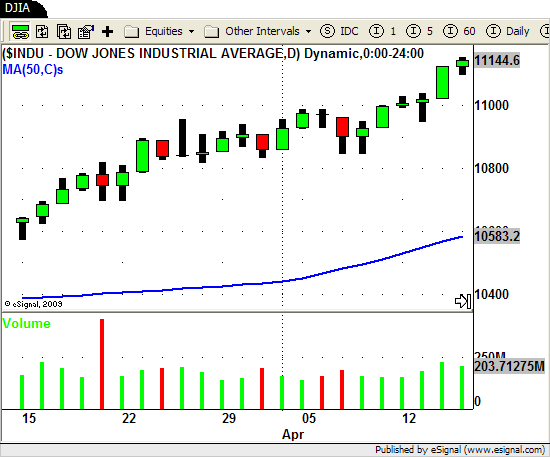
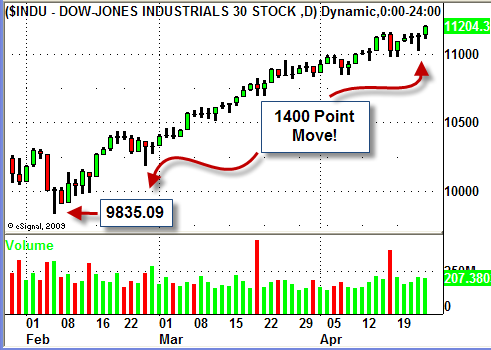
You can see from the chart above that the DJIA had another strong first four days of the week and hit another NEW HIGH for the year on Thursday.
One sector that took off like a rocket this week was the Semiconductors.
Here is a look at SMH (Semiconductors ETF)…
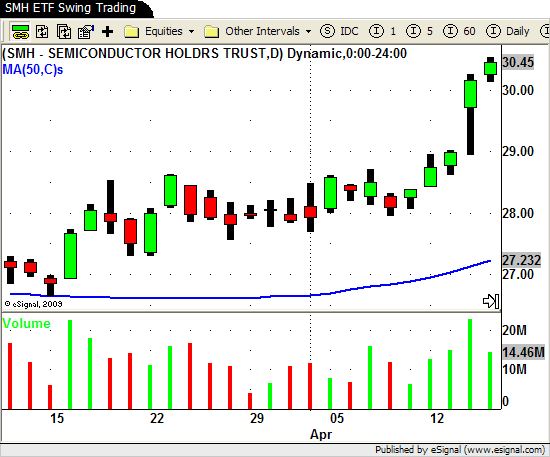
This chart is great combination of Swing Trading using price action, volume and price patterns.
Here is the same chart with annotations.
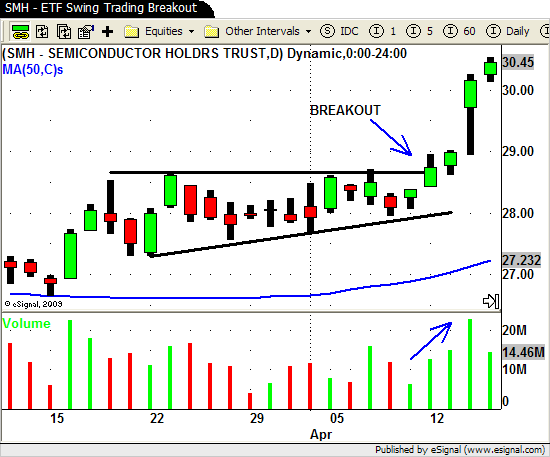
After consolidating for the last 3 weeks the SMH finally broke out of its price pattern on Monday.
As swing traders this is one of the most popular chart patterns we look for.
Horizontal resistance and an UP trending channel line gives us an ASCENDING TRIANGLE chart pattern.
This chart pattern gives us a LONG trade signal when we see a BREAKOUT above the overhead resistance area.
Notice the VOLUME increase during and after the breakout.
This is exactly what we want to see when we enter into and manage a position.
Indications of strong volume in the direction of our trade when the signal is generated and a continued increase in volume as the trade moves in our favor.
Now lets get back to Fridays trading action.
Being prepared for "anything" is essential if you truly wish to become a successful Swing Trader.
If you were "prepared for ANYTHING" going into Friday you would have a watch list that includes weak stocks, sectors and ETF's.
Our list included several stocks like DVN, SOHU, CAGC, CAAS, MOS and STLD that were showing signs of relative weakness lately.
And depending on your skill level as a swing trader, when Fridays news came out, you could have capitalized on several stocks with "weak" chart patterns.
Stocks like CPRT, NUE, FCX, T and GOLD.
One stock directly influenced by the news with a nice chart pattern was Morgan Stanley (MS).
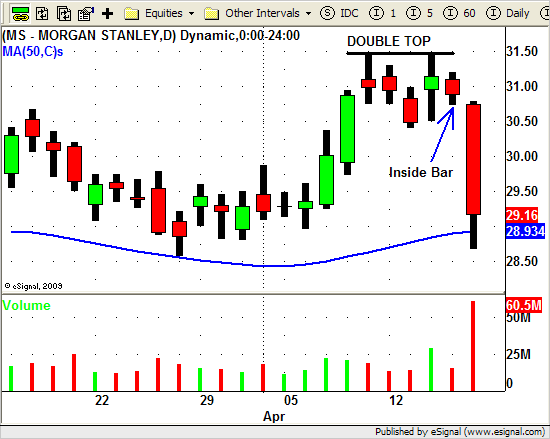
After MS formed a short term DOUBLE TOP on Wednesday (at $31.45) it was followed on Thursday by an INSIDE BAR.
INSIDE BARS basically indicate a "stall" in price action especially when LOW VOLUME accompanies this formation.
After Thursday's price and volume action had you taken notice of this temporary "stall" it may have made your "watch" list.
Then when Fridays news came out you would have looked first to MS to see if price action gave you an opportunity to enter into a new SHORT position.
Friday morning MS BROKE DOWN through Thursday's low in the first 5 minutes of trading.
This was your "heads up" since price was now BREAKING DOWN from this pattern.
The entire financial sector was weak all morning and when the news broke around 10:30am MS gave you a great SHORT setup near the $30.50 price level.
Again this is an aggressive trade that should be taken only by experienced swing traders.
Hopefully though it shows you how, with the proper mindset (being prepared for ANYTHING), you can profit when the unexpected opportunity presents itself.
Until next week…Good Trading to YOU!
