Posts Tagged ‘Swing Trading Price and Volume’

Swing Trading Update 05.31.19

Monday, June 3rd, 2019

Here is your Swing Trading update for the trading week ending 05.31.19.

After the holiday we saw a nice continuation to the DOWNSIDE in the market this week. 

With lots of people expecting some sort of bounce from an OVERSOLD position the charts always tell the true story…if you know how to read them.


S&P 500 ($SPY)

Swing Trading Strategies

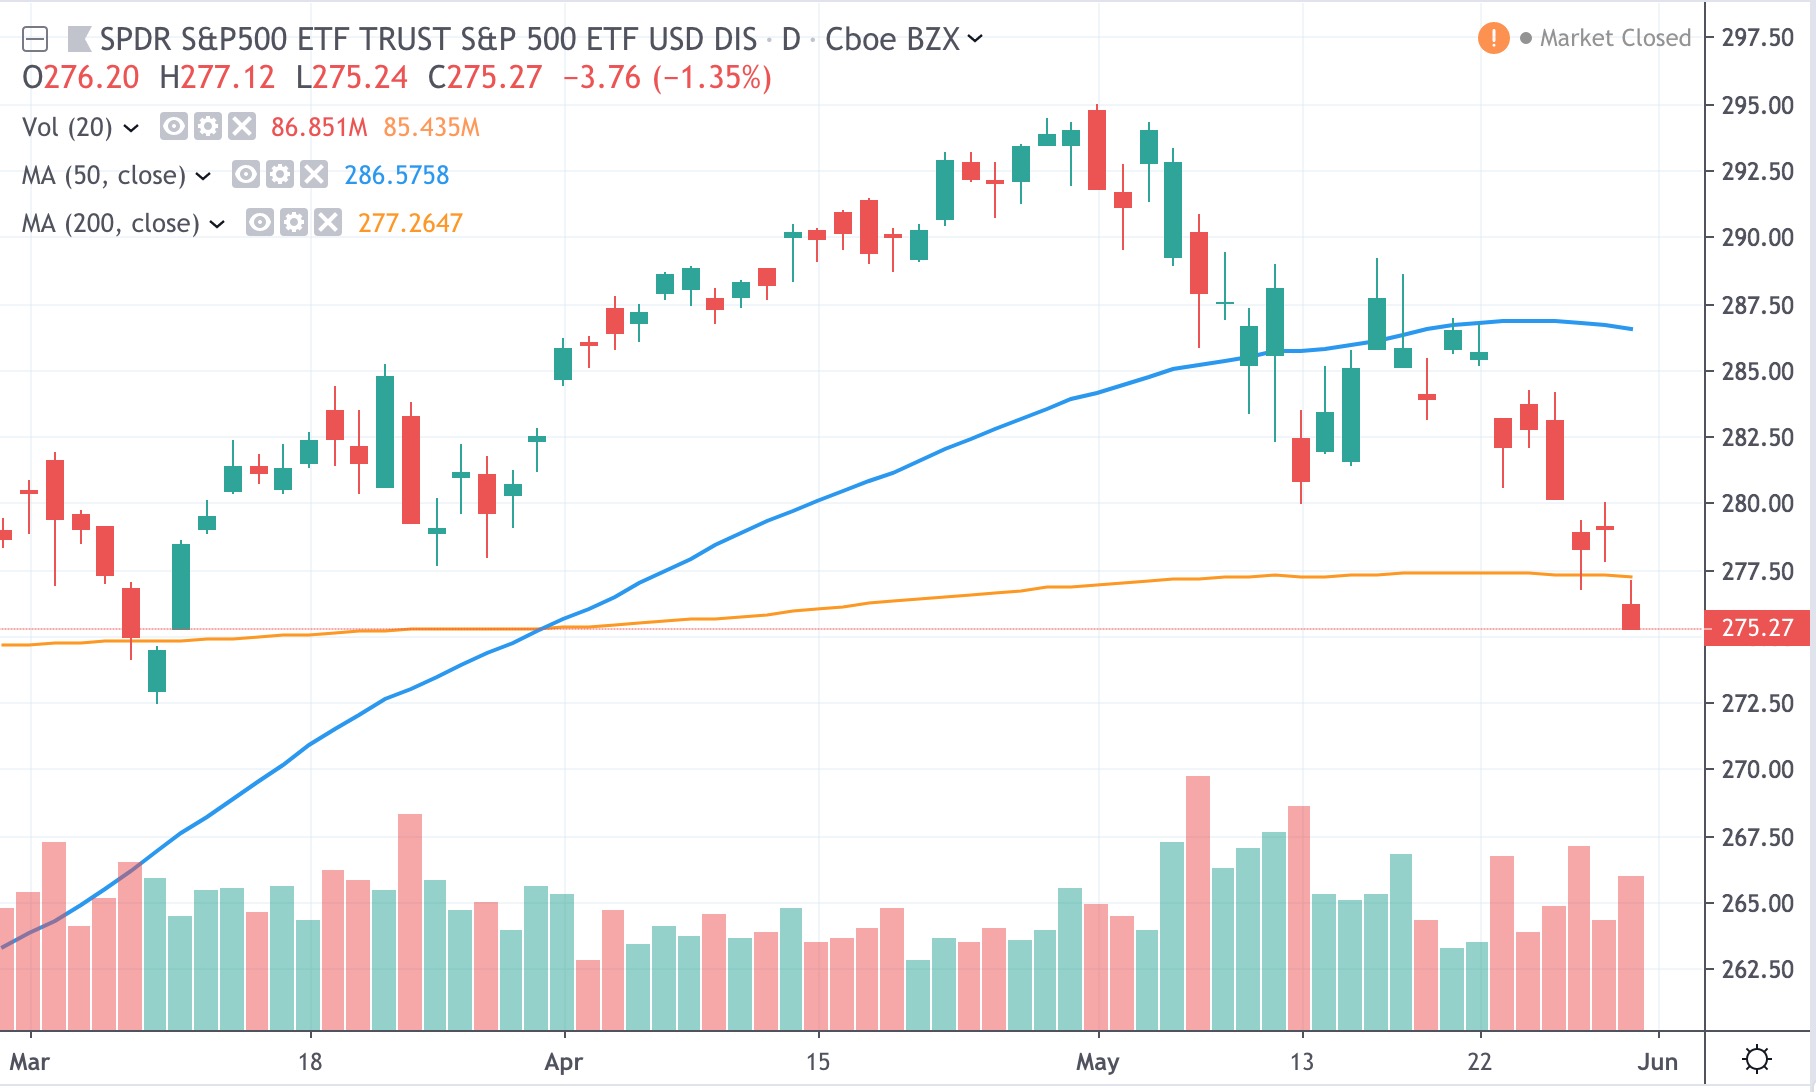
The S&P got rocked again this week (along with just about everything else.

Take a look at the chart. After pushing lower mid-week last week we saw 2 STALLbars near the LOW END of the trading range. When the market opened up on TUESDAY we saw the continued push LOWER on VOLUME, breaking down from the 2 STALL bars.


DJIA ($DIA)

Swing Trading Strategies

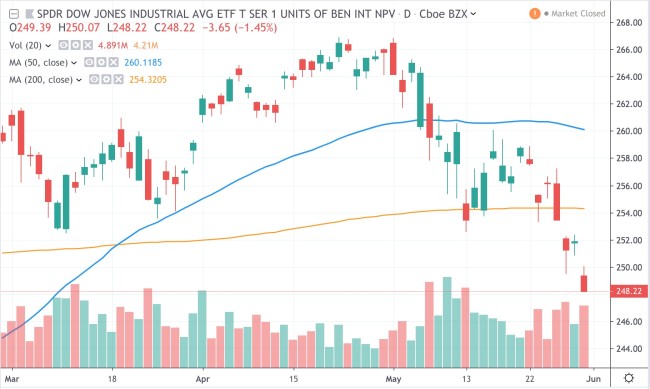
More of the same from the DJIA. Since the end of APRIL we are down 1800 points or so. Not good for the LONG SIDE especially since we are now under the 200-day MA.


GOLD ($GLD)

Swing Trading GOLD ETF's

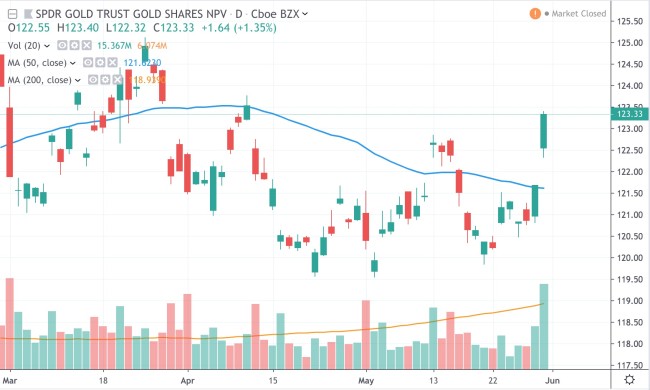
The sector to watch this week was GOLD. Considering the overall market conditions, the setup after the double bottom and pullback after 3 days above the 50-day MA setup a nice chance to get LONG (at 2 spots). 


SUMMARY

With ALL THREE INDICES (S&P, DJIA, NAZ) now trading below their 200-day MA's I would say that the writing on the wall is clear.

The failure to push to NEW HIGHS in early MAY was quickly followed by HEAVY SELLING which broke the UPTREND

After a small bounce and stall we saw continuation to the downside this week. 

And while there are still some strong stocks in the market we will wait to see if all of this selling pressure catches up to them as well.

I wouldn't chase stocks/ETF's down at this point but the next STALL or PULLBACKshould tells us how the story continues.

Until next week…GOOD TRADING TO YOU!

Intraday Swing Trading [Video] – Price Action and Volume

Wednesday, January 9th, 2013

Our Intraday swing trading strategies using price action and volume for the end of day trades for January 9, 2013.

When day trading stocks and ETFs we always watch what the overall market is doing and use that as a guide for our trades.

In this video I show you how the DJIA ($DIA) was attempting to trade lower in the last half hour of trading.

$BA was showing signs of relative strength and gave us a nice chart pattern to trade into the close.


Swing Trading Week in Review – November 19, 2010

Sunday, November 21st, 2010

Swing Trading BLOG – Swing Trading BOOT CAMP

The sell off continued to start out the week on a negative note.

By Thursday however we saw the buyers step back in and give the markets a lift to close out the week.

This recent sell off has taken the major indices back near their 50 period SMA's on INCREASING VOLUME which is a bit concerning.

SPY- Swing Trading

The "inside day" we saw in the markets on Wednesday was followed by less than impressive volume as the market rose Thursday and Friday.

It looks like we are at another pivotal level in the market and as always follow through (and how it does) is the key.

This low volume "bounce" could be quickly followed by MORE BUYING and an increase in volume.

This would be a great short term sign that the bulls are still in charge.

If however this low volume "bounce" is followed by AGGRESSIVE SELLING then the market could be in a for a significant move lower.

Some of the sector ETF's preformed quite well to close out the week while others are showing signs of tremendous weakness.

The Oil Services (OIH) and Energy ETF's (XLE) had nice moves to the upside.

OIH- Swing Trading ETF XLE

The Semiconductor ETF (SMH) remains strong after it's recent BREAKOUT and we will continue to look for signs of follow through in this sector.

SMH

Silver (SLV) also made it's next UP SWING after a decent pull back from it's most recent high.

SLV - Silver ETF

The two sector's we focused on in last weeks BLOG POST…The Financial's (IYF, XLF) and the Homebuilders (XHB)…have now pulled back to a  level that is BELOW their recent breakout points.

IYF XHB

Both sector's are hovering around their 50 DAY SMA's and are still in a "zone" that COULD hold as support but this type of deep pullback after a HIGH VOLUME breakout is NOT a great sign.

Even though the market is showing a bit of weakness recently there were still plenty of opportunities to take some LONG trades this week.

Several stocks on our Watch List set up for some nice trades this week.

Stocks on this list were $LULU, $COG, $MRVL, $WLK, $X, $BRCM, $TIF, $MEE and $HAL (to name a few).

LULU

Even though the market is still technically in a very BULLISH phase it is at, what we believe, at very pivotal level.

For the first time in several weeks we are actually seeing a number of  SHORT trade setups.

During this recent sell off in the market several stocks have actually started to show signs of weakness.

$ERTS, $LLY, $G, $K, and $MED are a few on our list that are relatively weak.

The Real Estate sector (and the stocks within) have all been hit hard during this recent sell off.

$SPG, $DRE, $KIM and $O have sold off hard recently and a "bounce" could happen in the very near future but the price action and volume we have seen during this sell off has us looking to the SHORT side in this sector.

Next week should give us a good indication of where the market is headed from here.

You may have heard this before but…BE PREPARED FOR ANYTHING!

Until next week…Good Trading to YOU!

© Swing Trading Boot Camp 2024