Posts Tagged ‘SLX’

Swing Trading Week in Review – April 30, 2010

Saturday, May 1st, 2010

After making NEW YEARLY HIGHS on Monday the market finished down almost 1.8% this week.

Sellers came out in force on Tuesday but the market quickly rebounded Wednesday and Thursday.

The low volume "rebound" came to end on Friday as sellers stepped in again creating a sell off that drove the market down right until the closing bell.
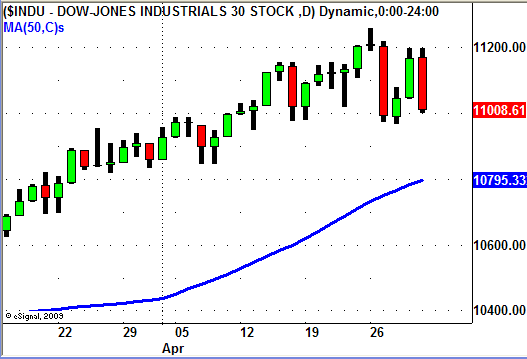
Dow Jones Index 4/30/10

As far as individual sectors go, the Financial ETF's (XLF, IAI, IYF), all made another move lower this week.

We have been watching this sector closely since the negative news came out about Goldman Sachs.

Last week we noticed, and posted to our blog, that the Financial ETF's were not showing much strength as the market made its move up on Thursday and Friday.

The follow through to the down side started on Monday allowing us go LONG the Inverse Financial ETF (FAZ) for a nice short term swing trade.
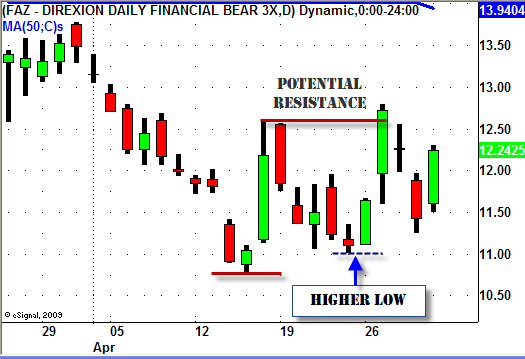
FAZ - Swing Trading ETF

After hitting resistance at the short term double top FAZ pulled back a bit and continued its UP move on Friday.

Another sector we have been watching closely is the Steel sector.

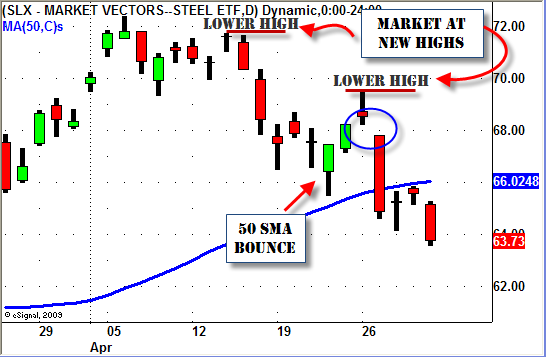
We began to notice the Steel ETF (SLX) was possibly running out of steam during the market move to new highs on April 14th and 15th.

SLX never made it to new highs as the market rallied and actually begin to sell off as the market made its new high on the 15th.

The weakness continued last week and as the market again rallied to NEW HIGHS by Friday, SLX made an unimpressive bounce off of the 50 Day SMA.

When the sellers stepped in on Tuesday this week SLX sold off right out of the gate and never looked back.

The "Gap Down and Go" as we call it created a "lower high" and was a good opportunity for a SHORT Swing Trade in this sector.
SLX - Swing Trading ETF

So what do we do going into next week?

With the market putting in its first significant "lower high" this week we will continue to look for signs of follow through to the down side.

As always though we will continue to look for opportunities on both the LONG and SHORT side of the market just in case the market finds its legs again and makes a run back towards the highs.

Just remember that being prepared for ANYTHING and EVERYTHING increases your chances of trading success.

Until next week…Good trading to YOU!

Swing Trading Week in Review – March 5, 2010

Friday, March 5th, 2010

And UP we go again!

Last week we said we were hopeful that the market would give us a clear direction and this week it did exactly that!

Last Thursday's price action had us looking to the LONG side and this week started off on Monday with a nice UP day letting us know we were on the right side of the market.

The market stalled a little mid week but by Thursday the buyers stepped in again and pushed the market higher right until the close on Friday!

The rally was wide spread with most sectors having nice gains this week.

Retail (RTH), Real Estate (IYR), and the Steel (SLX) sectors continued their strong runs.

Several stocks in these sectors had GREAT price and volume patterns that lead to some very nice swing trade set ups!

X, AKS, KIM, O, TIF, and JCG all are good examples of these set ups.

The Financials (XLF) and the Homebuilders (XHB) also rallied nicely allowing us to take some profits in these sectors by weeks end.

So how do we look going into next week?

After such a nice strong run up this week we see some stocks that are approaching short term overbought levels as well coming up to overhead resistance areas.

As Swing Traders its our job to identify the clues that the market gives us and to put all the pieces of the puzzle together to make a decision.

We the fast run up in these stocks, combined with short term overbought conditions AND coming into OBVIOUS overhead resistance it would be smart to tighten up your stops at this point to protect your open profits.

Some of our more recent positions are just starting to move into positive territory but the positions we opened at the end of last week we will be quick to exit at the first sign of weakness.

Do NOT chase the market up!

If we continue to rally sit on the sidelines and wait for the market to either pullback a bit or at least consolidate near the highs.

Be patient and wait for the low risk/ high reward opportunities…you will be glad you did!

Until next week…Good trading to YOU!


Swing Trading Week in Review – January 22, 2010

Friday, January 22nd, 2010

The DOW fell over 4% (over 400 points) this week closing at 10172.98.

The S&P 500 and NASDAQ followed suit also selling off around 4% each as well.

After last weeks price action (see last post) we took notice of the potential down move in the market.

When the market opened Tuesday, after being closed for the holiday on Monday, the market rallied strong and turned in a positive day closing near the highs of the day.

Traders had to think that the market could possibly be making another attempt towards the recent highs.

Our job as traders or active investors is to look for clues that the market gives to make our trading decisions.

Our clue that Tuesdays market action was a possible "fake out" was once again price action AND volume.

Even though the market had a nice up move on Tuesday the volume was light.

The volume clue was not only evident in the overall market but in the sector ETF's and individual stocks as well.

Lets look at the charts we posted last week to see how they played out.

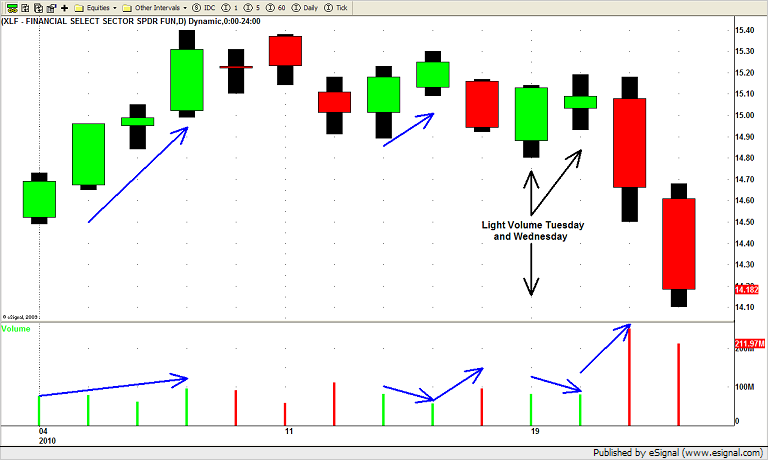
First we take at look at the XLF (Financials ETF).

XLF ETF

Tuesday's light volume reversal day as followed by a lighter volume day on Wednesday with price closing near the mid point of the day.

Price action AND volume then follow through to the DOWN side nicely on Thursday and Friday.

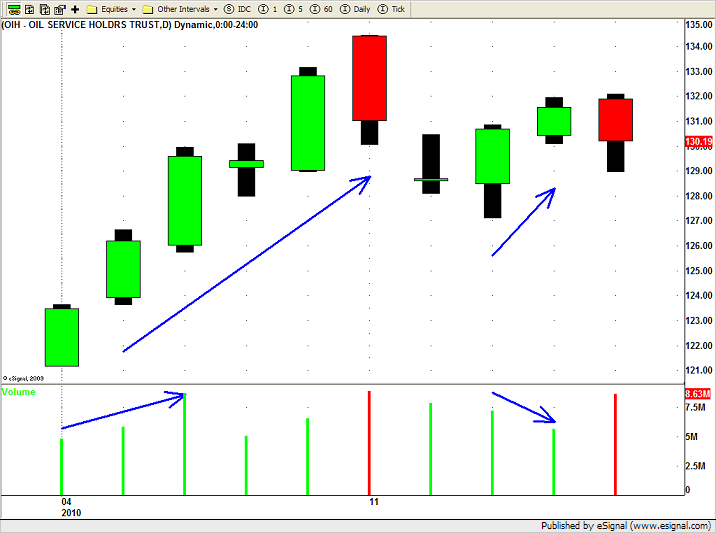
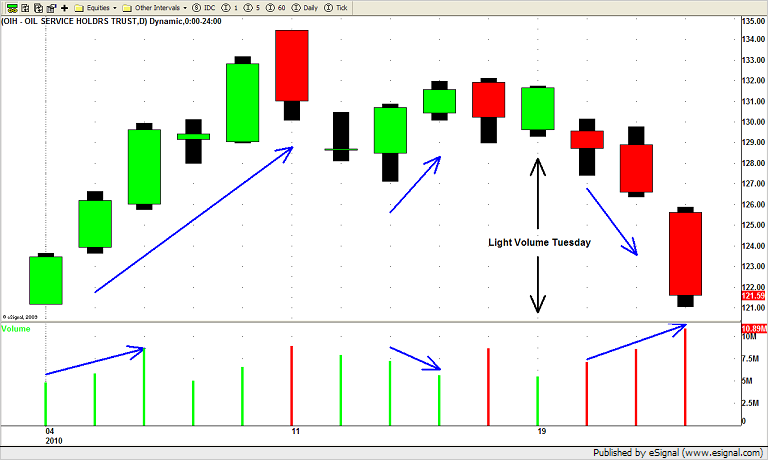
Here is the OIH (Oil Servies ETF) chart.

OIH

You can see how even though the sector had a nice up day on Tuesday the volume was light.

Wednesdays price action (down) on increasing volume confirmed that price was heading lower (even if only temporarily).

The selling accelerated on Thursday and Friday pushing price lower closing near the lows of the week.

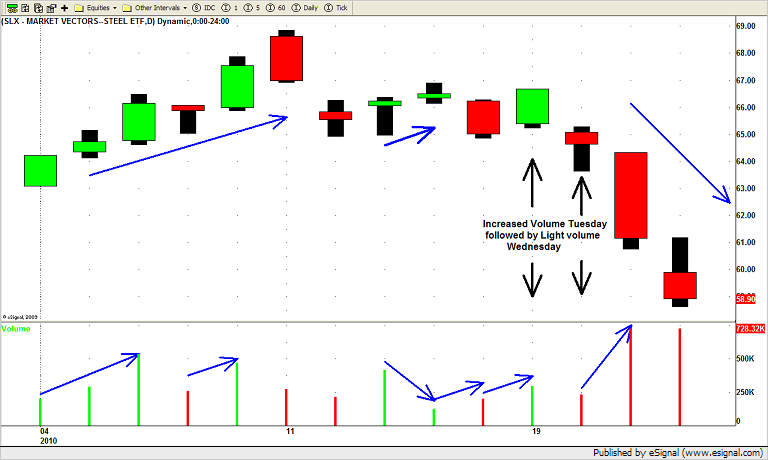
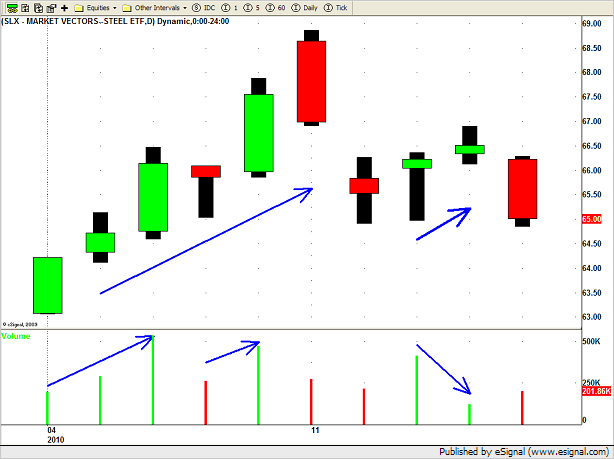
And finally lets look at the SLX (Steel ETF) chart we posted last week.

SLX ETF

This one was a little tricky for a few reasons.

The Steel sector has been on fire recently so when Tuesday's price and volume action showed a possible run towards the recent highs we entered into a new LONG position.

By Wednesdays open we knew we were probably wrong on this trade but as always we stick to our trading plan and dont try to out guess the market.

Wednesdays gap down and lackluster price movement on low volume was quickly followed by increased volume and downward price movement as selling finally came into the sector Thursday and Friday.

Yes we were stopped out for a LOSS on this trade but it happens and will happen again.

Our SHORT positions more than made up for this one losing trade.

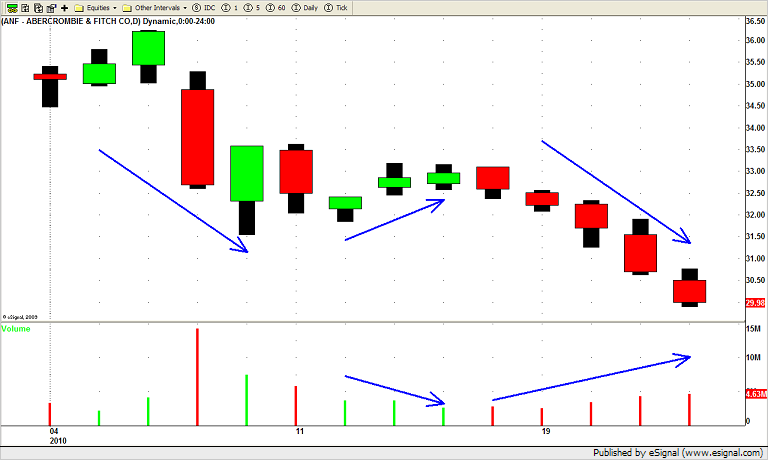
One, for example, that played out perfectly was our SHORT SWING TRADE in ANF.

ANF Short Swing Trade

ANF triggered a SHORT SWING TRADE for us last Friday (1/15/2010).

The sector (retail) has been weak and ANF was showing signs of obvious weakness as well.

Notice how ANF did not participate in the markets UP move on Tuesday as price "stalled" on lower volume.

Wednesday ANF quickly followed through by trading lower on increased volume and the rest of the week was more of the same.

At pivotal times in the market we frequently find ourselves having a few LONG positions (in stocks showing relative strength) and a few SHORT positions (in stocks showing relative weakness).

Once the market gives us a clear signal (like it did this week) we can take the appropriate action and get on the right side of the market.

Until next week…Good Trading to you!

Swing Trading Week in Review- January 15,2010

Friday, January 15th, 2010

What a way to end the week!

The indexes all closed DOWN on HUGE VOLUME today…The Dow closed down -100.90 (-0.94%), while the S&P 500 lost -12.42 (-1.08%), and the Nasdaq finished down -28.75 (-1.24%).

Some of the strongest stocks (CREE, MRVL, DE, RIG, APC, X, CAT) followed suit also trading significantly lower on heavy volume.

We were able to lock in our profits from last weeks swing trades by being prepared for a move we somewhat anticipated.

So what were the clues?

Well take a look at this weeks price action.

After last weeks strong up move you have to expect a pullback in the market.

Monday and Tuesday saw they S&P and Nasdaq pullback a bit while the Dow held pretty steady.

Monday we did note that some of last weeks strongest ETF's (OIH, XLE, SLX) gapped up on Monday and then sold off to finish near their lows.

The strong stocks also pulled back a bit as expected.

Nothing too alarming but a clue to POSSIBLE things to come.

The next few days painted a different picture from the previous up move.

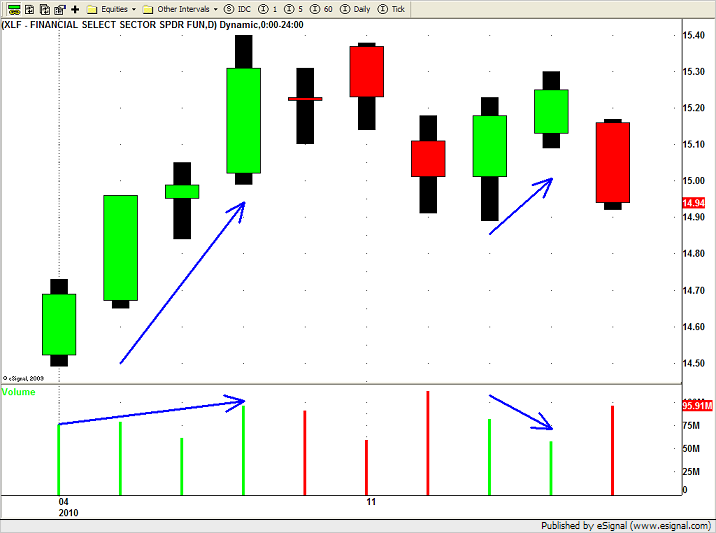
One of the things we noticed that really stood out on Wednesday and Thursday was the amount of stocks and ETF's that were pushing higher on DECREASING VOLUME!

Take a look at the chart patterns to see what we mean.

Here is XLF (Financial ETF)…

XLF - Swing Trading ETF

And the OIH (Oil Services ETF)

OIH - Swing Trading ETF

And finally the SLX (Steel ETF)…

SLX_1152010

Now you can see how they all attempted to move higher on DECREASING volume.

Dominant moves (UP in this case) on LOWER VOLUME should turn on the CAUTION light for you.

If you pull up some of the individual stocks you will notice the same chart patterns.

Stocks like DO, RIG, APC, MEE, WFC, JPM and X all have similar stories.

Once we noticed the signals that PRICE ACTION and VOLUME gave us we were a little cautious getting overly LONG.

Now, no one can predict the future, and POSITIVE volume could have come back into the market the next day so we were prepared if that would have been the case.

We held our remaining LONG positions and actually added 2 more during this time however we DIDNT LOAD THE BOAT!

When todays (Friday) sell off happened we were well prepared.

We tightened up our stops on our LONG positions and when we were stopped out of some of them today we were able to hold on to our hard earned swing trading profits!

Now that being said the market could do an about face on Monday and head right back up.

But at least for now we locked in our profits and have no problem entering into new LONG positions if the market take off again.

When you see LOWER volume UP moves it means you need to start paying very close attention!

It does'nt mean to EXIT your positions or start shorting strong stocks in a strong market but it does tell you that things MAY, and I repeat MAY, change.

Once you see the warning sign it prepares you to TAKE ACTION if price action confirms the change (like it did today).

We like to see price action AND volume working together we we enter into our trades.

UP moves (in this case) on strong volume and pullbacks on lower volume.

When the two dont match up they are telling you something…WARNING WARNING…Sentiment MAY change here (even temporarily) so HEADS UP!

By learning to read and interpret price action, volume and chart patterns together you can see the "big picture", that way you are always prepared to take whatever action the market calls for.

Until Next week…Good Trading to You!

© Swing Trading Boot Camp 2024